Figures & data
Table 1 Demographic and baseline characteristics of patients per treatment group
Figure 1 Disposition of patients.
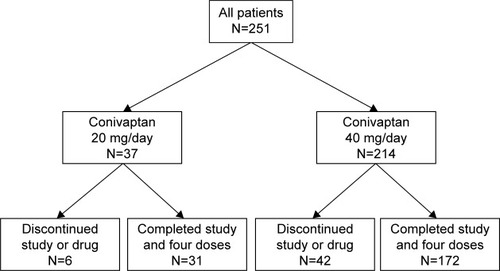
Table 2 Baseline sNa-AUC and baseline-adjusted sNa-AUC during the treatment period by treatment group and volume status
Table 3 Time (hours) to first confirmed ≥4 mEq/L increase in sNa relative to baseline
Table 4 Cumulative time (hours) sNa was increased by at least ≥4 mEq/L relative to baseline
Figure 2 Rate of sNa correction in hypervolemic and euvolemic patients over 4 days of treatment with either 20 or 40 mg/day conivaptan.
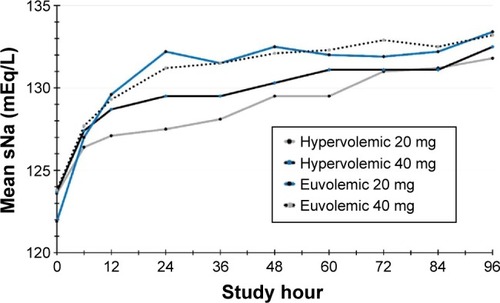
Figure 3 Mean serum sodium (sNa) values following 4 days of treatment with conivaptan 20 mg/day (A) or 40 mg/day (B).
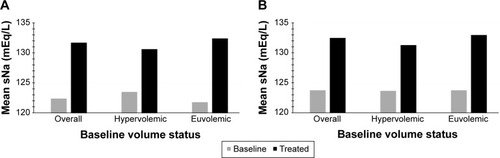
Table 5 Serum sodium (mEq/L) at follow-up relative to baseline
Table 6 All adverse events occurring in at least 5% of patients in either treatment group
Table 7 Characteristics of subjects discontinued from treatment due to a rapid increase in sNa
Table 8 All infusion-site reactions
Table 9 All serious adverse events occurring in ≥3 patients of either treatment group
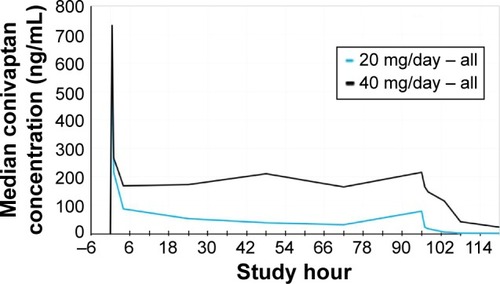
Figure 4 Median plasma concentrations of conivaptan following initial loading dose (study hour 0.5) and 4 days of treatment with either 20 or 40 mg/day conivaptan in the total treatment population.
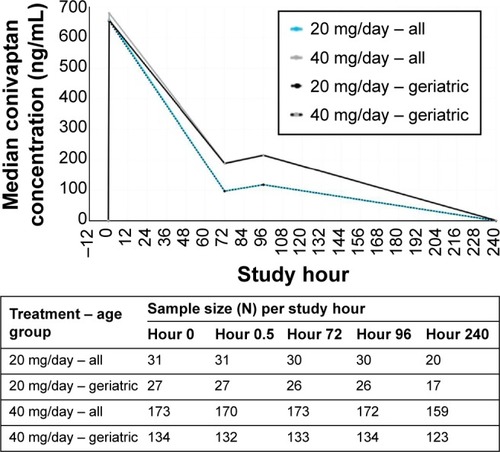
Figure 5 Median plasma concentrations of conivaptan following initial loading dose (study hour 0.5) and 4 days of treatment with either 20 or 40 mg/day conivaptan in the PK-rich sampling group (N=8 per group).