
Figures & data
Figure 1 Ribbon representation of HIV-1 RT-GSK952 complex.
Abbreviations: RT, reverse transcriptase; PDB, Protein Data Base.
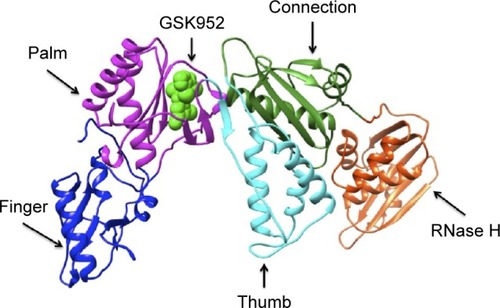
Figure 2 The 2D structure of ligand GSK952 used to generate the pharmacophore model.
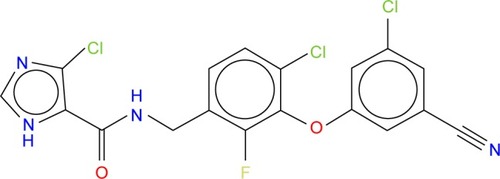
Figure 3 A schematic representation of the VS workflow used in the current study.
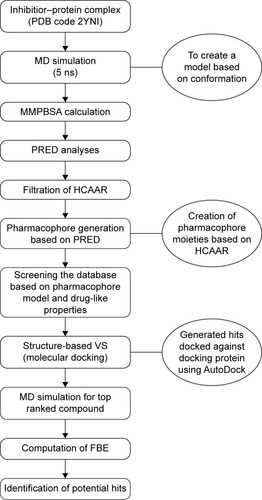
Figure 4 A diagrammatic representation of the pharmacophore model.
Abbreviations: PRED, per-residue energy decomposition; FBE, free binding energy; vdW, van der Waals; Elec, electrostatic; 2D, two dimensional.
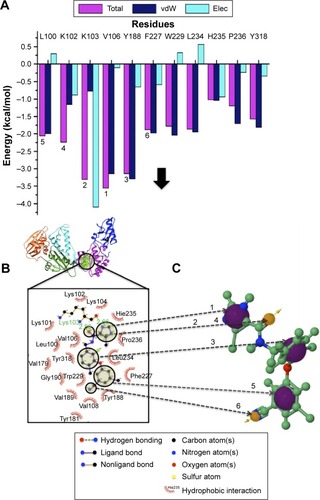
Table 1 Validation of molecular docking approach
Figure 5 Validation of molecular docking: docking score vs half maximal inhibitory concentration (IC50).
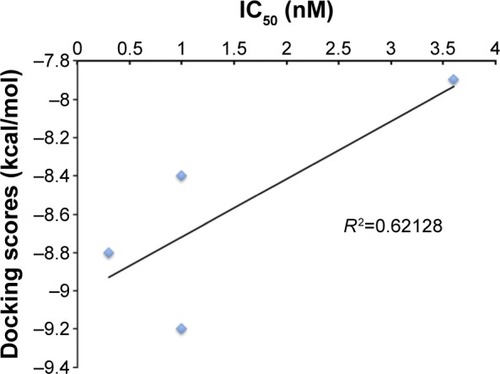
Table 2 Representation of the top ten compounds displaying 3D shapes, HBD, HBA, xlogP, MW, and calculated DS and RB
Table 3 A comparison of GSK952’s binding affinity with that of the top two hits ZINC54359621 and ZINC46849657
Figure 6 The per residue graphs showing FBE contribution for both ZINC54359621 and ZINC46849657.
Abbreviations: FBE, free binding energy; vdW, van der Waals; Elec, electrostatic.
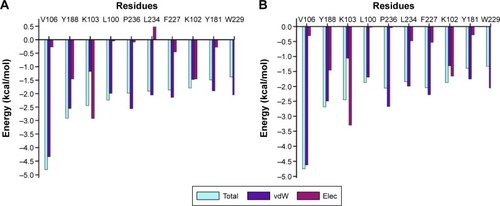
Figure 7 Binding mode of compounds.
Abbreviation: RT, reverse transcriptase.
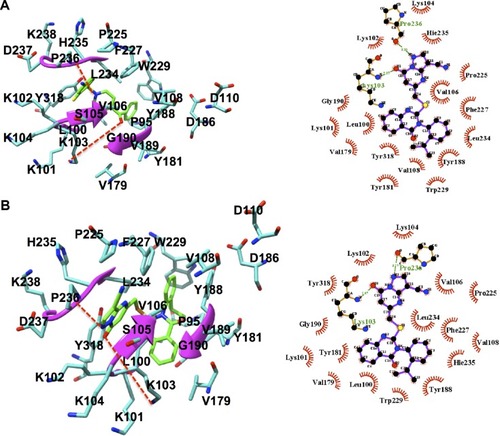
Figure S1 Two key binding interactions exist between GSK952 and the backbone NH and C=O groups of Lys103 of HIV-1 RT.
Figure S2 PRED-based pharmacophore model.
Figure S3 MD simulation results of ZINC54359621 and ZINC46849657.
Abbreviations: MD, molecular dynamic; RMSD, root-mean-square deviation; RMSF, root-mean-square fluctuation; Rg, radius of gyration.
Table S1 PRED of highly interacting residues