Figures & data
Figure 1 Characterization of dendrimers/DNA NPs.
Notes: (A) Electrophoretic analysis of DNA binding assay with different weight ratios (PAMAM to DNA). 1) DNA ladder, 2) naked DNA, 3) 0.1:1, 4) 0.5:1, 5) 1:1, 6) 3:1. (B) Transmission electron microscope (TEM) image of PAMAM-PEG-Tf/DNA NPs. Bar =100 nm.
Abbreviations: NP, nanoparticle; PAMAM, polyamidoamine dendrimer; PEG, polyethyleneglycol; Tf, transferrin.
Abbreviations: NP, nanoparticle; PAMAM, polyamidoamine dendrimer; PEG, polyethyleneglycol; Tf, transferrin.
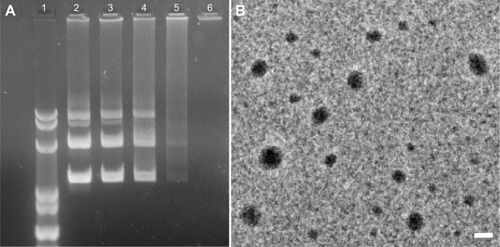
Figure 2 Cellular uptake of NPs in C6 cells.
Notes: Naked Trail, PAMAM-PEG/Trail, and PAMAM-PEG-Tf/Trail were incubated for 2 hours and examined under the fluorescence microscope. Red signal was EMA-labeled Trail.
Abbreviations: EMA, ethidium monoazide bromide; NP, nanoparticle; PAMAM, polyamidoamine dendrimer; PEG, polyethyleneglycol; Tf, transferrin.
Abbreviations: EMA, ethidium monoazide bromide; NP, nanoparticle; PAMAM, polyamidoamine dendrimer; PEG, polyethyleneglycol; Tf, transferrin.
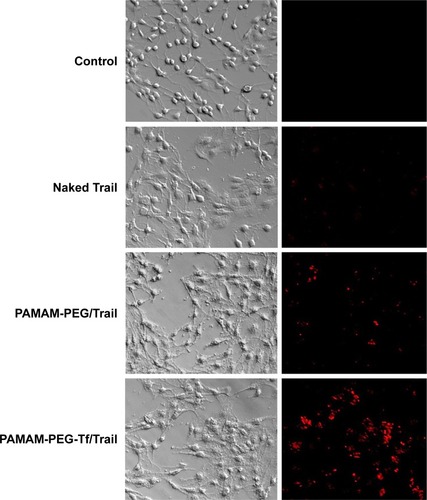
Figure 3 In vitro gene expression of NPs in C6 cells.
Notes: PBS (A), naked pEGFP (B), PAMAM-PEG/pEGFP (C), and PAMAM-PEG-Tf/pEGFP (D) were incubated for 2 hours and the fluorescence images of GFP were taken 48 hours after incubation.
Abbreviations: NP, nanoparticle; PBS, phosphate-buffered saline; PAMAM, polyamidoamine dendrimer; PEG, polyethyleneglycol; pEGFP, plasmid encoding enhanced green fluorescence protein; Tf, transferrin.
Abbreviations: NP, nanoparticle; PBS, phosphate-buffered saline; PAMAM, polyamidoamine dendrimer; PEG, polyethyleneglycol; pEGFP, plasmid encoding enhanced green fluorescence protein; Tf, transferrin.
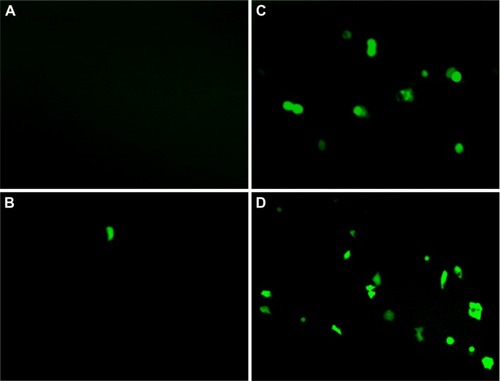
Figure 4 In vitro cell apoptosis.
Notes: C6 cells were treated with PBS (A), naked Trail (B), PAMAM-PEG/Trail (C), and PAMAM-PEG-Tf/Trail (D) for 2 hours and the apoptosis cells were labeled with Annexin V-FITC Apoptosis Detection Kit 48 hours after incubation. The apoptosis rate was quantified by flow cytometry.
Abbreviations: PBS, phosphate-buffered saline; PAMAM, polyamidoamine dendrimer; PEG, polyethyleneglycol; Tf, transferrin; FITC, fluorescein isothiocyanate; UL, upper left; UR, upper right; LL, lower left; LR, lower right.
Abbreviations: PBS, phosphate-buffered saline; PAMAM, polyamidoamine dendrimer; PEG, polyethyleneglycol; Tf, transferrin; FITC, fluorescein isothiocyanate; UL, upper left; UR, upper right; LL, lower left; LR, lower right.
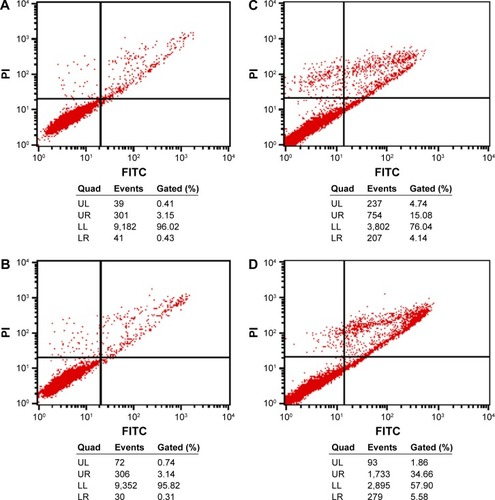
Figure 5 In vivo distribution of NPs in C6 glioma model.
Notes: Fluorescent imaging of C6 glioma model administrated with PAMAM-PEG/Trail (A and C) or PAMAM-PEG-Tf/Trail (B and D). Images were taken 2 hours after administration.
Abbreviations: NP, nanoparticle; PAMAM, polyamidoamine dendrimer; PEG, polyethyleneglycol; Tf, transferrin.
Abbreviations: NP, nanoparticle; PAMAM, polyamidoamine dendrimer; PEG, polyethyleneglycol; Tf, transferrin.
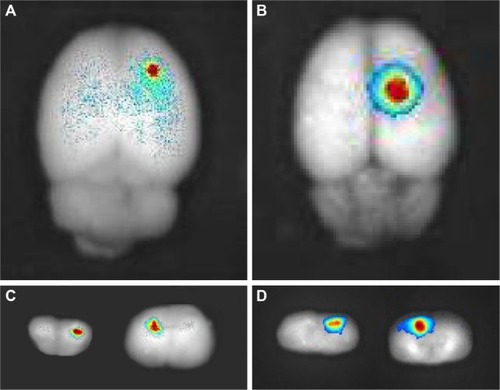
Figure 6 Qualitative evaluation of in vivo gene expression.
Notes: Distribution of gene expression in C6 glioma-bearing rat brain treated with PAMAM-PEG/pEGFP and PAMAM-PEG-Tf/pEGFP 48 hours after intravenous administration. Frozen sections (20 µm thick) were examined by fluorescent microscopy. The sections were stained with 300 nM DAPI for 15 minutes at room temperature. Blue: cell nuclei, green: GFP. Inside the white plot shows glioma region.
Abbreviations: DAPI, 4,6-diamidino-2-phenylindole; PAMAM, polyamidoamine dendrimer; pEGFP, plasmid encoding enhanced green fluorescence protein; PEG, polyethyleneglycol; Tf, transferrin.
Abbreviations: DAPI, 4,6-diamidino-2-phenylindole; PAMAM, polyamidoamine dendrimer; pEGFP, plasmid encoding enhanced green fluorescence protein; PEG, polyethyleneglycol; Tf, transferrin.
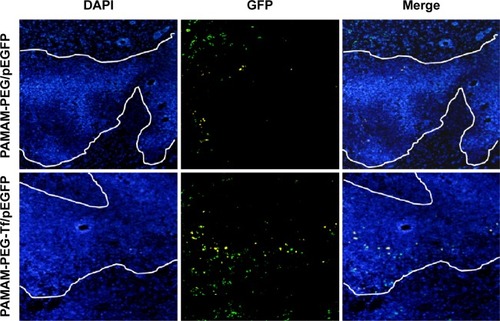
Figure 7 In vivo tumor apoptosis detection.
Notes: Effects of Saline, PAMAM-PEG-Tf/pEGFP, Temozolomide, PAMAM-PEG/Trail, and PAMAM-PEG-Tf/Trail treatments on apoptosis of C6 brain tumors in margin region (A) and central region (B). At day 18 after implantation, rats were sacrificed for immunohistochemistry. Frozen sections of brain tumors were immunostained for the presence of DNA fragments (TUNEL). Slides were developed with DAB and counterstained with methyl green. Blue lines stand for the edge of tumor. Red arrows disclosed apoptosis. Insets present the enlarged apoptosis areas.
Abbreviations: PAMAM, polyamidoamine dendrimer; PEG, polyethyleneglycol; pEGFP, plasmid encoding enhanced green fluorescence protein; Tf, transferrin; TUNEL, terminal deoxynucleotidyl transferase-Biotin-dUTP nick end labeling; DAB, diaminobenzidine.
Abbreviations: PAMAM, polyamidoamine dendrimer; PEG, polyethyleneglycol; pEGFP, plasmid encoding enhanced green fluorescence protein; Tf, transferrin; TUNEL, terminal deoxynucleotidyl transferase-Biotin-dUTP nick end labeling; DAB, diaminobenzidine.
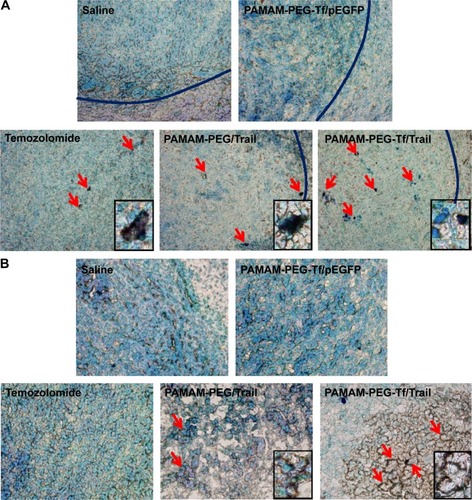
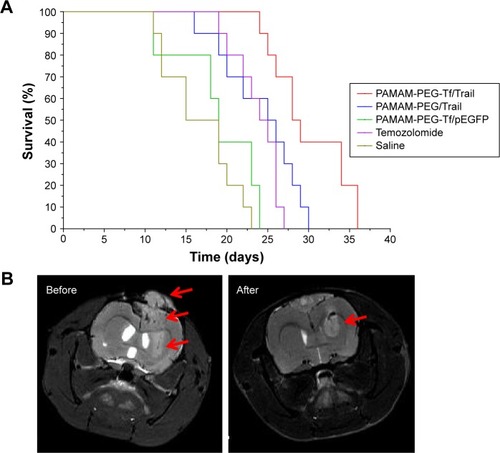
Figure 8 Therapeutic effect evaluation.
Notes: (A) Kaplan–Meier survival curve of C6 glioma-bearing rats received treatments of Saline, PAMAM-PEG-Tf/pEGFP, Temozolomide, PAMAM-PEG/Trail, and PAMAM-PEG-Tf/Trail, n=10. (B) MRI imaging of C6-bearing rat brain before and after PAMAM-PEG-Tf/Trail treatments at day 8, 10, 12, 14, and 16 after implantation. Red arrows indicated the tumor region.
Abbreviations: PAMAM, polyamidoamine dendrimer; PEG, polyethyleneglycol; pEGFP, plasmid encoding enhanced green fluorescence protein; MRI, magnetic resonance imaging; Tf, transferrin.
Abbreviations: PAMAM, polyamidoamine dendrimer; PEG, polyethyleneglycol; pEGFP, plasmid encoding enhanced green fluorescence protein; MRI, magnetic resonance imaging; Tf, transferrin.