Figures & data
Figure 1 Schematic representation of the study design.
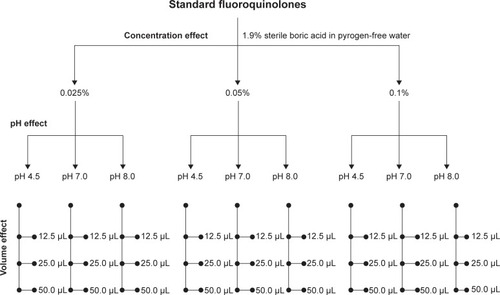
Table 1 Spectral masses and different parameters used for the analysis of the fluoroquinolones
Figure 2 LC-MS spectra for all the fluoroquinolones.
Abbreviation: LC–MS, liquid chromatography–mass spectrometry.
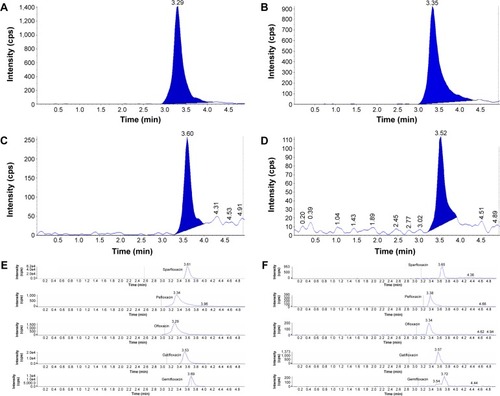
Figure 3 Effect of different concentrations at pH 4.5 (A), pH 7.0 (B), and pH 8.0 (C) on transcorneal penetration of FQs at volume of instillation of 12.5 μL.
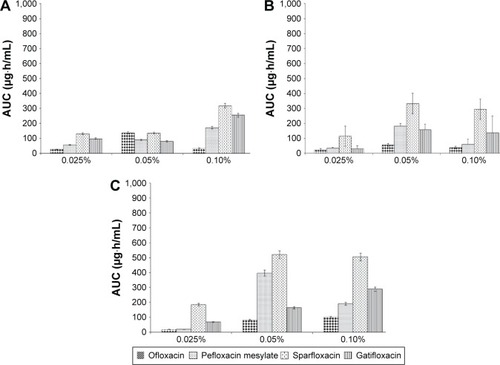
Figure 4 Effect of different concentrations at pH 4.5 (A), pH 7.0 (B), and pH 8.0 (C) on transcorneal penetration of FQs at volume of instillation of 25 μL.
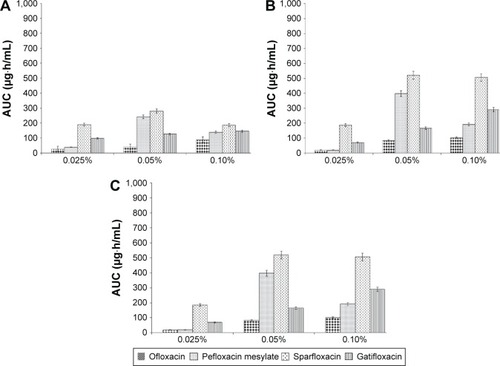
Figure 5 Effect of different concentrations at pH 4.5 (A), pH 7.0 (B), and pH 8.0 (C) on transcorneal penetration of FQs at volume of instillation of 50 μL.
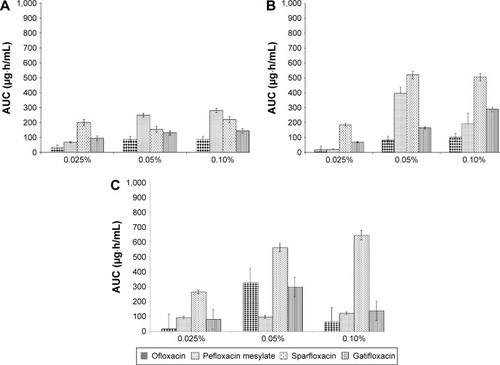
Figure 6 Effect of different pH on transcorneal penetration of FQs at concentration of 0.025% (A), 0.05% (B), and 0.1% (C) with drop volume of 12.5 μL.
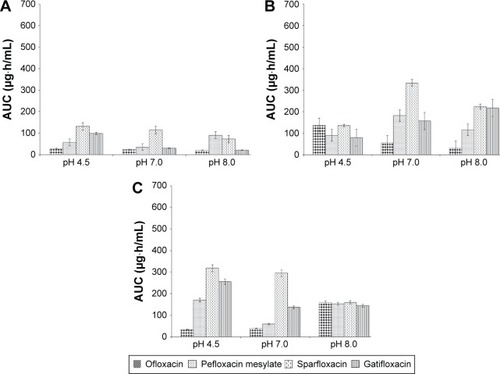
Figure 7 Effect of different pH on transcorneal penetration of FQs at concentration of 0.025% (A), 0.05% (B), and 0.1% (C) with drop volume of 25 μL.
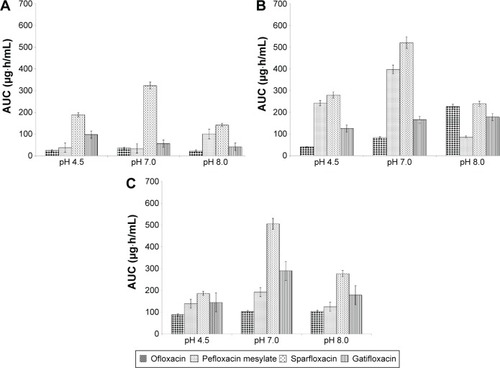
Figure 8 Effect of different pH on transcorneal penetration of FQs at concentration of 0.025% (A), 0.05% (B), and 0.1% (C) with drop volume of 50 μL.
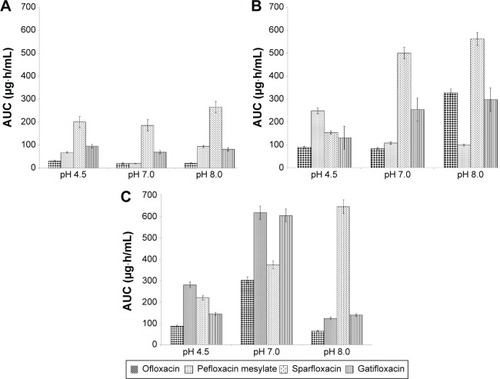
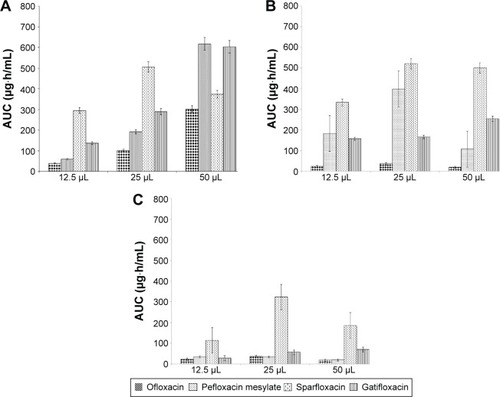
Figure 9 Effect of different volumes of instillation at pH 4.5 (A), pH 7.0 (B), and pH 8.0 (C) on transcorneal penetration of FQs at the concentration of 0.025%.
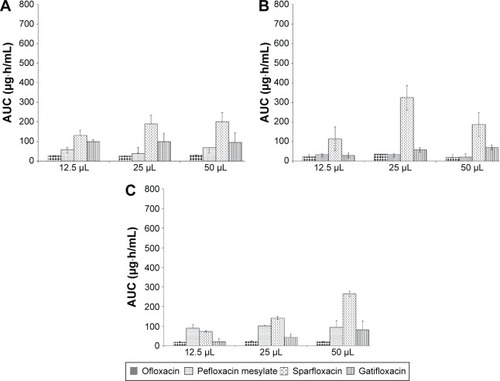
Figure 10 Effect of different volumes of instillation at pH 4.5 (A), pH 7.0 (B), and pH 8.0 (C) on transcorneal penetration of FQs at the concentration of 0.05%.
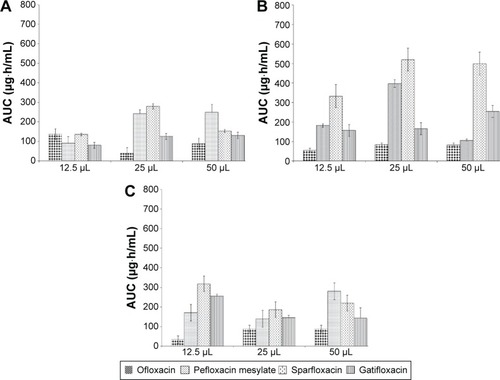
Figure 11 Effect of different volumes of instillation at pH 4.5 (A), pH 7.0 (B), and pH 8.0 (C) on transcorneal penetration of FQs at the concentration of 0.1%.