
Figures & data
Table 1 Pharmacokinetic characteristics of nemonoxacin in 12 healthy Chinese volunteers after a single oral dose of 500 mg of nemonoxacin alone or with probenecid
Figure 1 Plasma concentration–time curves for nemonoxacin after a single oral dose of 500 mg of nemonoxacin alone or with probenecid in 12 healthy Chinese volunteers.
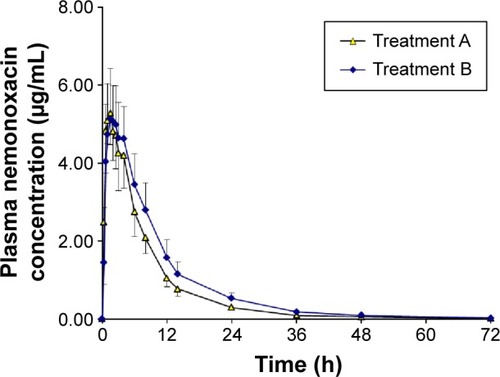
Figure 2 Urinary recovery–time curves for nemonoxacin after a single oral dose of 500 mg of nemonoxacin alone or with probenecid in 12 healthy Chinese volunteers.
Abbreviation: Fe, percentage of the administered dose recovered in the urine.
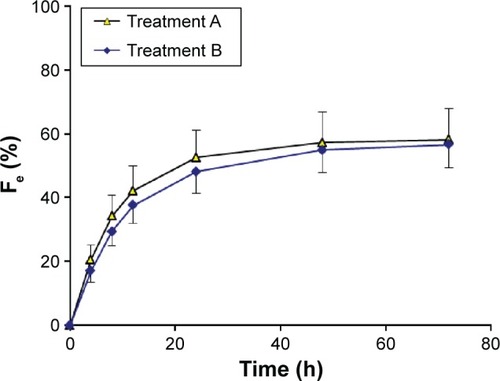
Table 2 Pharmacokinetic properties of nemonoxacin in 12 healthy Chinese volunteers after a single oral dose of 500 mg of nemonoxacin alone or with cimetidine
Figure 3 Plasma concentration–time curves for nemonoxacin after a single oral dose of 500 mg of nemonoxacin alone or with cimetidine in 12 healthy Chinese volunteers.
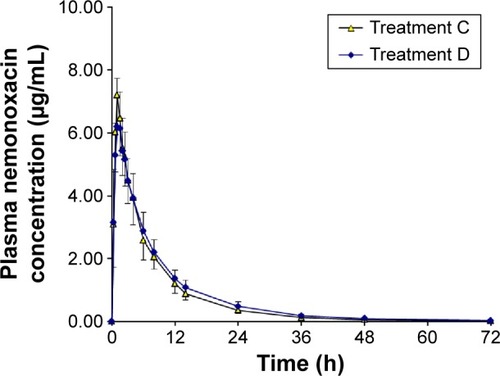
Figure 4 Urinary recovery–time curves for nemonoxacin after a single oral dose of 500 mg of nemonoxacin alone or with cimetidine in 12 healthy Chinese volunteers.
Abbreviation: Fe, percentage of the administered dose recovered in the urine.
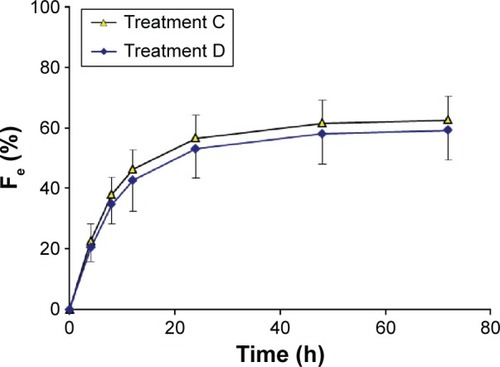
Figure S1 Product ion spectra of [M + H]+ of nemonoxacin (A) and moxifloxacin (B).
Abbreviation: Rel int, relative intensity.
![Figure S1 Product ion spectra of [M + H]+ of nemonoxacin (A) and moxifloxacin (B).](/cms/asset/305efe50-b252-448e-b773-0c1a38579d7b/dddt_a_12182258_s0001_b.gif)
Figure S2 Typical chromatograms of nemonoxacin and moxifloxacin (IS) in plasma.
Abbreviations: IS, internal standard; Rel int, relative intensity.
Figure S3 Typical chromatograms of nemonoxacin and moxifloxacin (IS) in urine.
Abbreviations: IS, internal standard; Rel int, Relative intensity.
Table S1 Precision and accuracy of the LC–MS/MS method to determine nemonoxacin in human plasma or urine (in pre-study validation, n=3 days, six replicates per day)