Figures & data
Figure 1 Schematic flow diagram for selection of included studies.
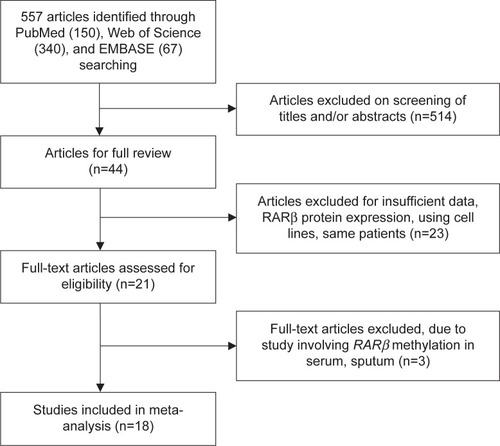
Table 1 Main characteristics of included studies
Figure 2 Forest plot for RARβ hypermethylation in NSCLC and non-neoplastic lung tissue.
Abbreviations: NSCLC, non-small-cell lung carcinoma; CI, confidence interval; df, degree of freedom; M–H, Mantel–Haenszel.
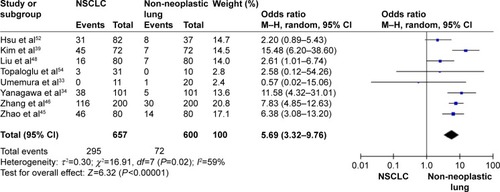
Figure 3 Forest plot for RARβ hypermethylation in AC and SCC.
Abbreviations: AC, adenocarcinoma; SCC, squamous cell carcinoma; CI, confidence interval; df, degree of freedom; M–H, Mantel–Haenszel.
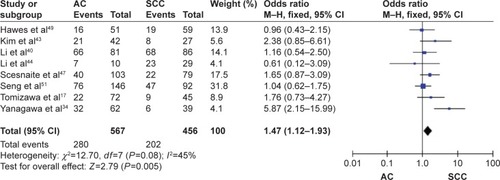
Figure 4 Forest plot for RARβ hypermethylation in advanced and low stage of NSCLC.
Abbreviations: NSCLC, non-small-cell lung carcinoma; CI, confidence interval; df, degree of freedom; M–H, Mantel–Haenszel.
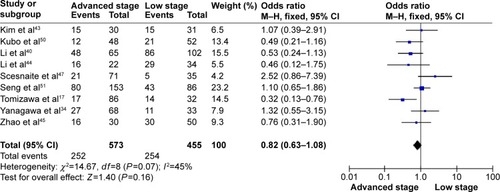
Figure 5 Forest plot for RARβ hypermethylation of NSCLC in smoking and nonsmoking individual.
Abbreviations: NSCLC, non-small-cell lung carcinoma; CI, confidence interval; df, degree of freedom; M–H, Mantel–Haenszel.
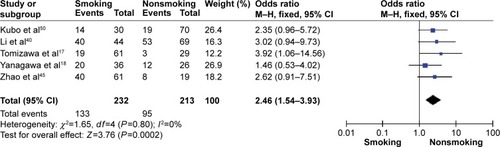
Figure 6 Forest plot for RARβ hypermethylation of NSCLC in different sexes.
Abbreviations: NSCLC, non-small-cell lung carcinoma; CI, confidence interval; df, degree of freedom; M–H, Mantel–Haenszel.
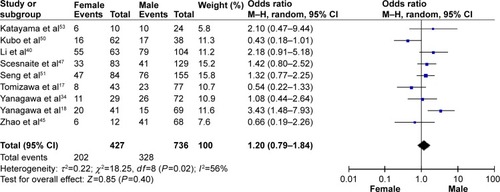
Figure 7 Forest plot for the association between RARβ hypermethylation and risk of NSCLC.
Abbreviations: NSCLC, non-small-cell lung carcinoma; CI, confidence interval; df, degree of freedom; SE, standard error of the mean.
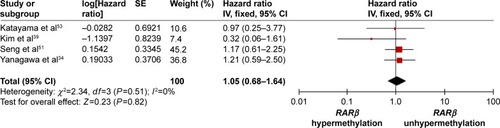
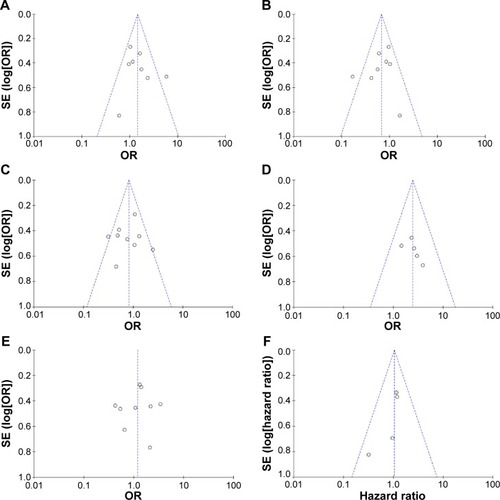
Figure 8 Funnel plot for publication bias.
Notes: (A) RARβ hypermethylation in NSCLC and non-neoplastic lung tissue; (B) RARβ hypermethylation in AC and SCC; (C) RARβ hypermethylation in advanced and low stage of NSCLC; (D) RARβ hypermethylation of NSCLC in smoking and nonsmoking individual; (E) RARβ hypermethylation of NSCLC in different sexes; (F) the association between RARβ hypermethylation and the risk of NSCLC.
Abbreviations: NSCLC, non-small-cell lung carcinoma; AC, adenocarcinoma; SCC, squamous cell carcinoma; SE, standard error of the mean; OR, odds ratio; df, degree of freedom.
Abbreviations: NSCLC, non-small-cell lung carcinoma; AC, adenocarcinoma; SCC, squamous cell carcinoma; SE, standard error of the mean; OR, odds ratio; df, degree of freedom.