Figures & data
Figure 1 Chromatogram profile of YQFM.
Notes: Identification of main components in YQFM was as follows: 1, ginsenoside Rg1; 2, ginsenoside Rf; 3, 20(S)-ginsenoside Rg2; 4, ginsenoside Rb1; 5, ginsenoside Rc; 6, ginsenoside Rb2; 7, ginsenoside Rd; 8, schizandrol A; 9, ginsenoside Rg6; 10, ginsenoside F4; 11, ginsenoside Rh4/Rk3; 12, 20(S)-ginsenoside Rg3; 13, 20(R)-ginsenoside Rg3; 14, ginsenoside Rs3/isomer; 15, ginsenoside Rk1/Rg5; 16, ginsenoside Rk1/Rg5; 17, schizandrin A; 18, schizandrin B.
Abbreviation: YQFM, YiQiFuMai powder injection.
Abbreviation: YQFM, YiQiFuMai powder injection.
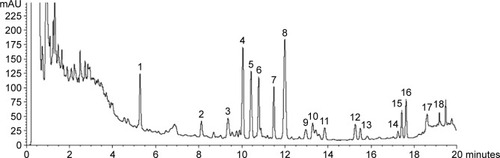
Figure 2 Effects of YQFM on brain injury in mice with cerebral I/R.
Notes: (A, B) infarct volume, (C) neurobehavioral outcomes, and (D) brain water content in mice with cerebral I/R. Mice were subjected to 1 hour of ischemia and 24 hours of reperfusion. YQFM was administered 1 hour after ischemia. Data are expressed as mean ± SD, n=6. ##P<0.01 vs sham mice; *P<0.05 vs I/R mice, **P<0.01 vs I/R mice.
Abbreviations: I/R, ischemia–reperfusion; SD, standard deviation; XST, XueShuanTong injection; YQFM, YiQiFuMai powder injection.
Abbreviations: I/R, ischemia–reperfusion; SD, standard deviation; XST, XueShuanTong injection; YQFM, YiQiFuMai powder injection.
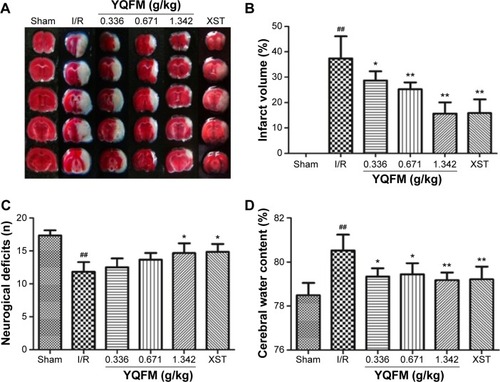
Figure 3 Effect of YQFM on regional cerebral blood flow in mice with cerebral I/R.
Notes: (A) The representative images of cerebral blood flow of ipsilateral cortex in different groups. The magnitude of CBF is represented by different colors, with blue to red denoting low to high. (B) Quantitative analysis of CBF in different groups. Data are expressed as mean ± SD, n=6. ##P<0.01 vs sham mice; *P<0.05 vs I/R mice, **P<0.01 vs I/R mice.
Abbreviations: CBF, cerebral blood flow; I/R, ischemia–reperfusion; SD, standard deviation; XST, XueShuanTong injection; YQFM, YiQiFuMai powder injection.
Abbreviations: CBF, cerebral blood flow; I/R, ischemia–reperfusion; SD, standard deviation; XST, XueShuanTong injection; YQFM, YiQiFuMai powder injection.
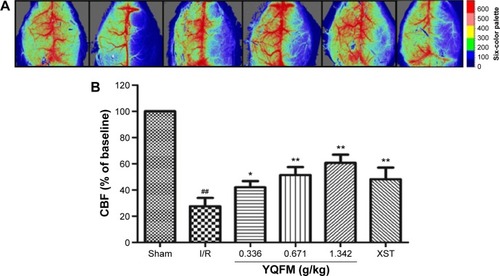
Figure 4 Effect of YQFM on blood–brain barrier permeability in mice with cerebral I/R.
Notes: (A) Representative gross appearance of EB-stained brains from mouse subject to 1-hour ischemia followed by 24 hours of reperfusion. (B) Quantitative analysis of EB extravasation by spectrophotometry. Data are expressed as mean ± SD, n=6. ##P<0.01 vs sham mice; *P<0.05 vs I/R mice, **P<0.01 vs I/R mice.
Abbreviations: EB, Evans Blue; I/R, ischemia–reperfusion; SD, standard deviation; XST, XueShuanTong injection; YQFM, YiQiFuMai powder injection.
Abbreviations: EB, Evans Blue; I/R, ischemia–reperfusion; SD, standard deviation; XST, XueShuanTong injection; YQFM, YiQiFuMai powder injection.
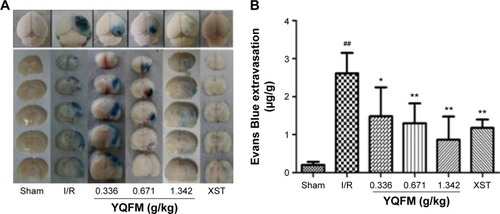
Figure 5 Effect of YQFM on histopathological changes of brain sections in mice with cerebral I/R.
Notes: (A) (18F-FDG) PET imaging of a mouse brain before and after I/R, and representative coronal PET images of (18F-FDG) at the lesion area after surgery. The black arrows indicate the damaged region. Scale bars =200 mm. (B) Hematoxylin-and-eosin-stained slides of the brain sections of mouse in different groups were examined under a light microscope. Representative stained sections showed a gradual improvement in condensed nuclei in cortical cells in the high-dose YQFM (1.342 g/kg) treatment group. Scale bar =50 µm; n=3.
Abbreviations: 18F-FDG, 18F-fluorodeoxyglucose; I/R, ischemia–reperfusion; PET, positron emission tomography; SD, standard deviation; YQFM, YiQiFuMai powder injection.
Abbreviations: 18F-FDG, 18F-fluorodeoxyglucose; I/R, ischemia–reperfusion; PET, positron emission tomography; SD, standard deviation; YQFM, YiQiFuMai powder injection.
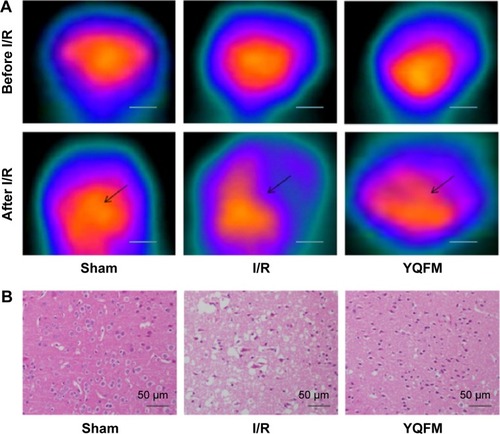
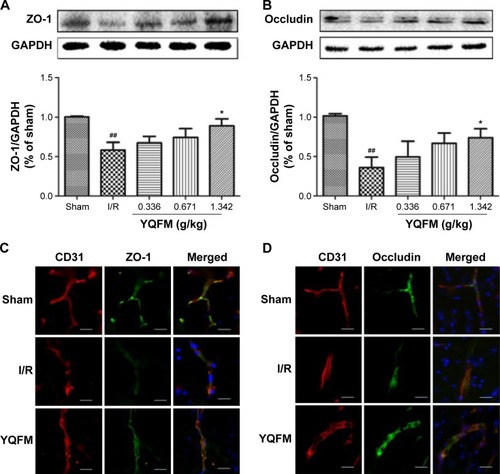
Figure 6 Effect of YQFM on the expression of tight junction proteins in mice with cerebral I/R.
Notes: (A, B) Representative Western blots and the quantitative analysis of the ratio of ZO-1 (A) and occludin (B). (C, D) Representative immunofluorescence microscope images of ZO-1 (green) and occludin (green) localized at the periphery of endothelial cells with the marker CD31 (red). DAPI-stained nuclei are depicted in blue. Scale bars =20 µm. Distribution of ZO-1 and occludin was disrupted in the I/R group and was reduced in the high-dose YQFM (1.342 g/kg) treatment group. Data (A, B) are expressed as mean ± SD, n=3. ##P<0.01 vs sham mice; *P<0.05 vs I/R mice.
Abbreviations: GAPDH, glyceraldehyde phosphate dehydrogenase; I/R, ischemia–reperfusion; PET, positron emission tomography; SD, standard deviation; YQFM, YiQiFuMai powder injection; ZO-1, zona occludens-1.
Abbreviations: GAPDH, glyceraldehyde phosphate dehydrogenase; I/R, ischemia–reperfusion; PET, positron emission tomography; SD, standard deviation; YQFM, YiQiFuMai powder injection; ZO-1, zona occludens-1.