Figures & data
Table 1 Animal grouping
Table 2 Antibacterial activity of the aqueous fraction of Moringa oleifera against bacterial isolates
Table 3 Minimum inhibitory concentration (MIC) of aqueous fraction of Moringa oleifera
Figure 1 A graph comparing the concentration of blood glucose level of normal rats with streptozotocin-induced diabetic rats at day 0, 3, 7, 14, and 21.
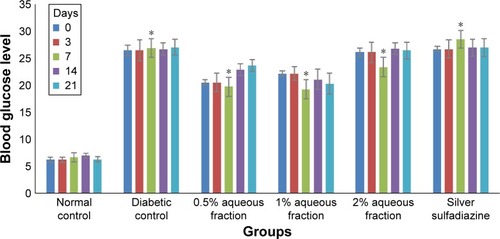
Figure 2 A graph comparing the concentration of insulin level of normal rats with streptozotocin-induced diabetic rats at 72 hours and 21 days after induction of diabetes.
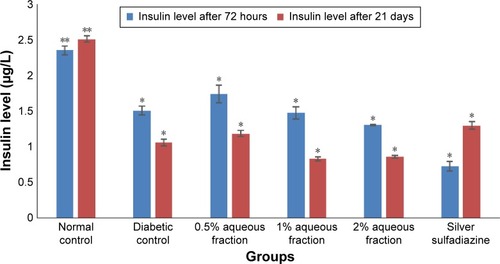
Figure 3 Histological features of hematoxylin–eosin stained sections of pancreatic tissue 21 days after induction of diabetes using a combination of streptozotocin and nicotinamide.
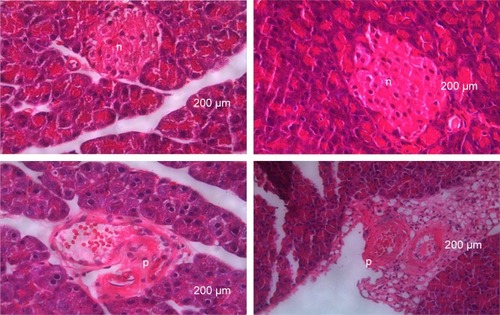
Figure 4 Digital photographs of excision wounds induced on normal control animals without treatment on day 0, 3, 7, 14, and 21 postwounding.
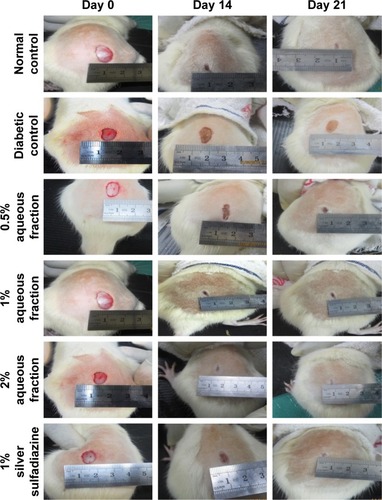
Figure 5 A graph of wound area analysis showing decrease in wound in diabetic-treated rats in a dose-dependent manner and the decrease was significant compared to untreated diabetic control (*P<0.05).
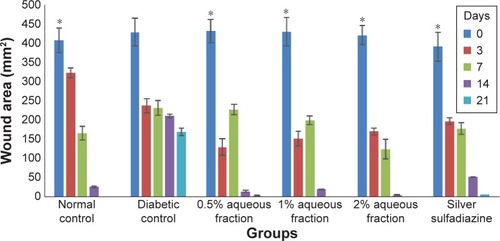
Figure 6 A graph of epithelialization period in control and diabetic-treated rats.
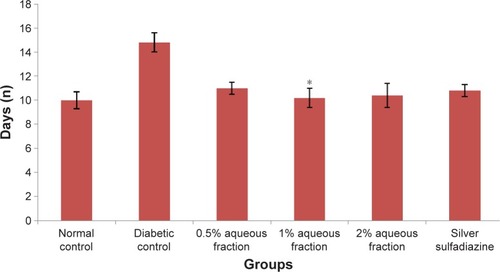
Figure 7 Hematoxylin–eosin histological sections of excisional wound site obtained from a diabetic wound treated with silver sulfadiazine (SSD).
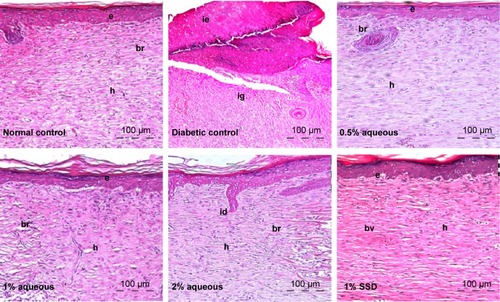
Table 4 Semiquantitative evaluation of histological parameters for the assessment of wound healing
Figure 8 A graph of cytokine regulation showing downregulation of interleukin-1β (IL-1β), interleukin-6 (IL-6), and tumor necrosis factor α (TNF-α) in wound tissue treated 21 days after treatment.
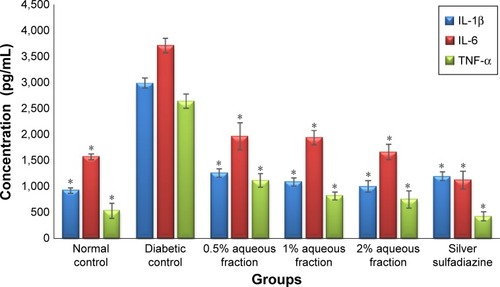
Figure 9 Effect of aqueous fraction on expression of cytokines showing upregulation and downregulation of various cytokines in tissues 21 days after treatment detected by Western blotting.
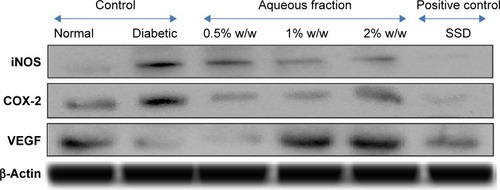
Figure 10 A graph showing analysis of expression of cytokines based on intensity of their bands obtained by image Lab software (Bio-Rad Laboratories Inc.).
Abbreviations: VEGF, vascular endothelial growth factor; iNOS, inducible nitric oxide synthase.
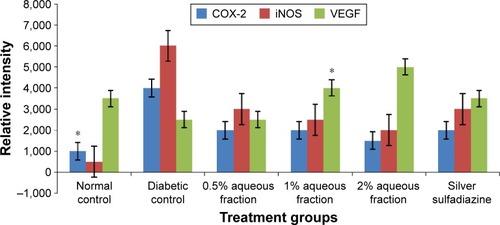
Figure 11 Effect of aqueous fraction of Moringa oleifera on vascular endothelial growth factor expression showing relative brown stain indicated by the black arrows in wound tissue of treated diabetic rats in skin wound tissues 21 days postwounding.
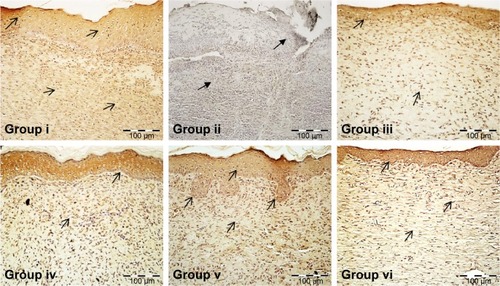
Figure 12 Possible mechanisms by which aqueous fraction enhances wound healing in diabetic condition.
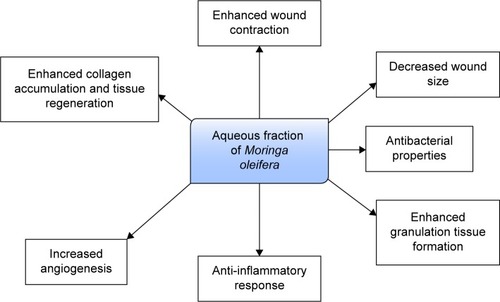
Figure S1 A graph of wound contraction rate in control and diabetic treated animals.
Figure S2 A graph showing estimates of amount of granulation tissue formed in control and diabetic rats.