Figures & data
Figure 1 (A) 3→3 linkages and (B) 4→3 linkages of the bacterial peptidoglycan layer.
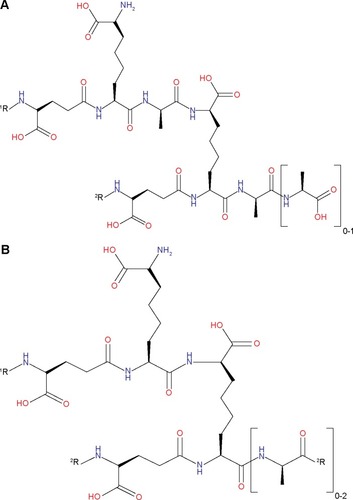
Figure 2 (A) Three-dimensional structure of LdtMt2 protein of Mtb (LdtMt2, PDB ID: 3TUR). (B) Molecular overlay picture of the downloaded LdtMt2 protein structure (green) and prepared LdtMt2 protein structure (pink).
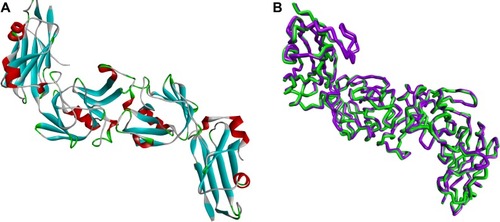
Table 1 ADMET and TOPKAT values of meropenem and the top 18 hit compounds
Figure 3 H37Ra growth inhibition (%) by compound 1 and compound 2 in comparison to the positive control, rifampicin.
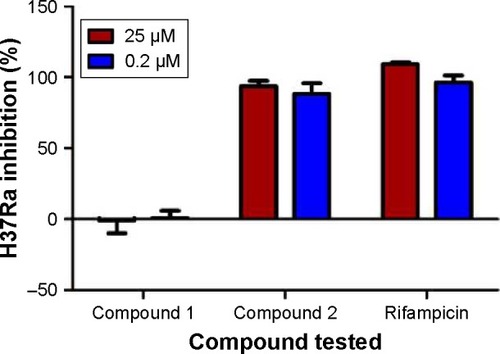
Figure 4 H37Ra growth inhibition (%) by compound 2 at 25 μM and 0.2 μM after 24 hours, 48 hours, and 72 hours.
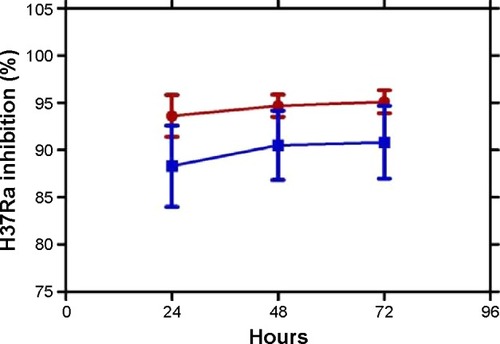
Table 2 2D structures and ligand interactions of meropenem and compound 2 in LdtMt2’s active site
Figure 5 2D ligand interaction diagram of meropenem with LdtMt2’s active site.
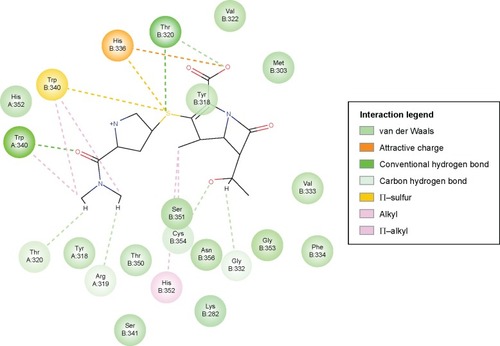
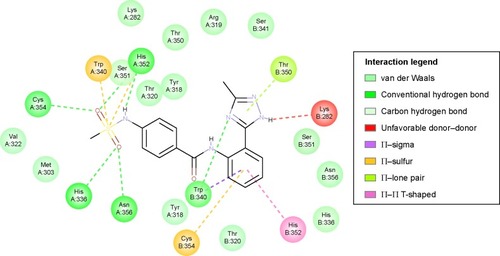
Figure 6 2D ligand interaction diagram of compound 2 with the LdtMt2 active site.