Figures & data
Figure 1 The chemical structure of (A) amsacrine and (B) amsacrine analog.
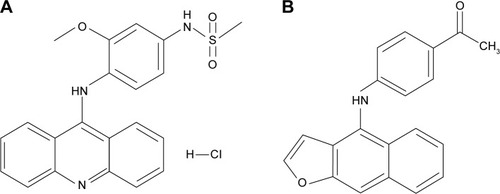
Table 1 Characterization of amsacrine analog–loaded solid lipid nanoparticles (SLNs) in terms of the particle size, polydispersity index (PDI), zeta potential, and entrapment efficiency, and stability changes following storage at room temperature (25°C) for 1 month
Figure 2 Transmission electron microscopic micrograph of amsacrine analog-loaded solid lipid nanoparticle (SLN) (original magnification ×100 K).
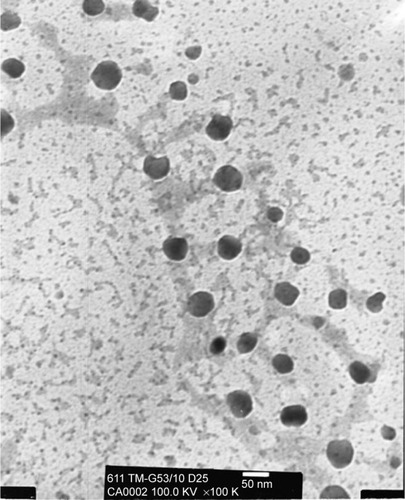
Figure 3 In vitro accumulative amount release versus time profiles of amsacrine analog from solid lipid nanoparticle (SLN).
Abbreviation: SD, standard deviation.
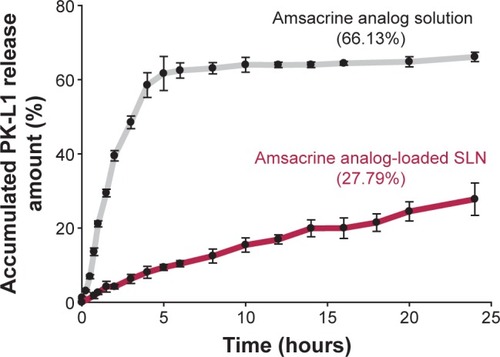
Table 2 Average pharmacokinetic parameters after intravenous administration of amsacrine analog solution and amsacrine analog-loaded SLN to mice with a dose of 8.4 mg/kg for 4 hours
Table 3 AUC and mean residence time of amsacrine analog in various organs upon administration of amsacrine analog with or without SLN
Figure 4 Concentration–time profiles in organs after intravenous administration of amsacrine analog with or without SLN at dose 8.4 mg/kg in mice.
Abbreviations: SLN, solid lipid nanoparticle; SD, standard deviation.
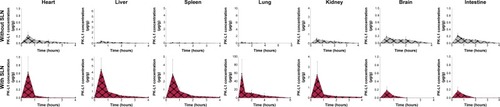
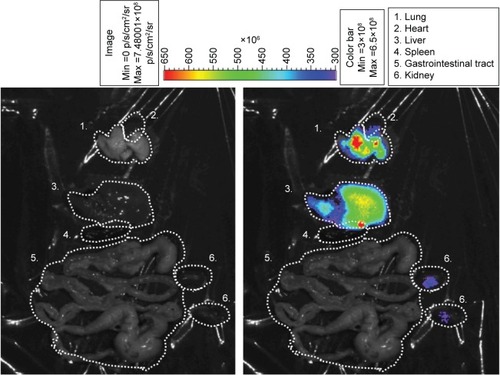
Figure 5 In vivo biodistribution images of IR-780-loaded SLN in mice by using IVIS technique. The left side is a bright field; the right side is the intensity of IR-780 in various organs. The color bar presents the signal efficiency of the fluorescence emission coming out from the violet.