Figures & data
Table 1 The primers for quantitative RT-PCR
Figure 1 The effects of PAP on the viability of BV2 cell.
Notes: BV2 cells were pretreated with PAP (0, 0.4, 2, 10, and 50 μg/mL) for 4 hours followed by LPS (100 ng/mL) stimulation for an additional 24 hours. Cell viability was measured by CCK-8 assay. Compared with the control group, pretreatment with 50 μg/mL of PAP significantly inhibited the cell viability (**P<0.05), while no significant difference was observed at the concentrations below 10 μg/mL (*P>0.05). The results are represented as the mean ± SD of three independent experiments.
Abbreviations: PAP, papaverine; LPS, lipopolysaccharide; CCK-8, Cell Counting Kit 8; SD, standard deviation; CON, control.
Abbreviations: PAP, papaverine; LPS, lipopolysaccharide; CCK-8, Cell Counting Kit 8; SD, standard deviation; CON, control.
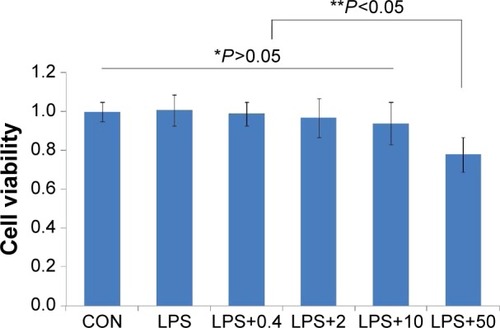
Figure 2 The transcription of proinflammatory genes after PAP pretreatment.
Notes: BV2 cells were pretreated with PAP (0, 0.4, 2, and 10 μg/mL) for 4 hours and received LPS stimulation for another 24 hours. Then total RNA was extracted for RT-PCR. (A–D) Shows the transcription of IL1β, TNFα, iNOS, and COX-2, respectively. LPS stimulation significantly increased the transcription of proinflammatory genes, while PAP pretreatment remarkably reversed these effects in a dose-dependent manner (*P<0.05). Remarkably, 0.4 μg/mL of PAP pretreatment was unable to suppress the transcription of COX-2 after LPS stimulation (**P=0.467). The results are represented as the mean ± SD of three independent experiments.
Abbreviations: PAP, papaverine; LPS, lipopolysaccharide; RT-PCR, reverse transcriptase polymerase chain reaction; SD, standard deviation; CON, control.
Abbreviations: PAP, papaverine; LPS, lipopolysaccharide; RT-PCR, reverse transcriptase polymerase chain reaction; SD, standard deviation; CON, control.
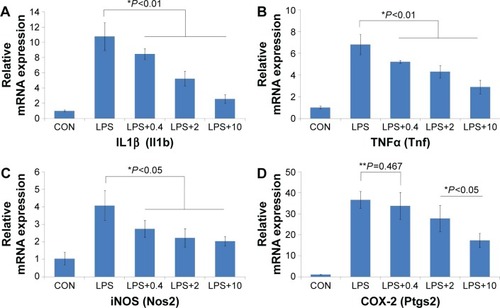
Figure 3 The production of IL1β and TNFα after PAP pretreatment.
Notes: Cells were pretreated with PAP (0, 0.4, 2, and 10 μg/mL) for 4 hours and incubated with LPS (100 ng/mL) for an additional 24 hours. The production of IL1β and TNFα was measured by ELISA. PAP pretreatment remarkably inhibited the production of IL1β (A) and TNFα (B) in a dose-dependent manner (*P<0.001). The results are represented as the mean ± SD of three independent experiments.
Abbreviations: PAP, papaverine; LPS, lipopolysaccharide; ELISA, enzyme-linked immunosorbent assay; SD, standard deviation; CON, control.
Abbreviations: PAP, papaverine; LPS, lipopolysaccharide; ELISA, enzyme-linked immunosorbent assay; SD, standard deviation; CON, control.
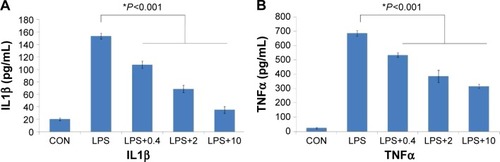
Figure 4 PAP modulated microglial phenotype transformation.
Notes: Cells were pretreated with PAP (0, 2, and 10 μg/mL) for 4 hours and incubated with LPS (100 ng/mL) for an additional 24 hours. The transcription of IL-1ra (Il1rn), SOCS3 (Socs3), Arg1 (Arg1), and CD206 (Mrc1) was measured by RT-PCR. (A and B) Shows PAP pretreatment significantly inhibited the transcription of M2b-associated markers IL-1ra (Il1rn), SOCS3 (Socs3) *P<0.01, but upregulated the transcription of M2a-associated markers Arg1 (Arg1) and CD206 (Mrc1) (C and D) *P<0.05. The results are represented as the mean ± SD of three independent experiments.
Abbreviations: PAP, papaverine; LPS, lipopolysaccharide; RT-PCR, reverse transcriptase polymerase chain reaction; SD, standard deviation; CON, control.
Abbreviations: PAP, papaverine; LPS, lipopolysaccharide; RT-PCR, reverse transcriptase polymerase chain reaction; SD, standard deviation; CON, control.
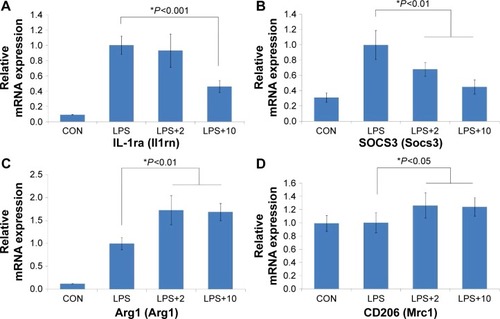
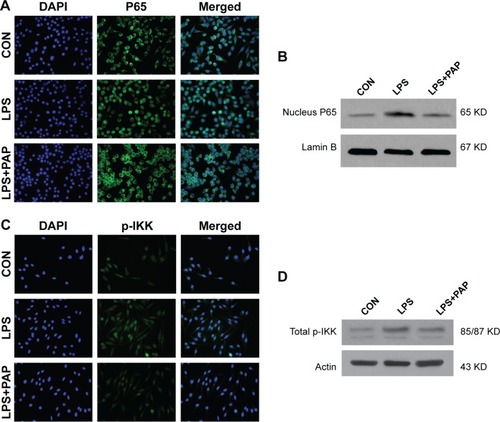
Figure 5 PAP suppressed LPS-induced microglial activation by NF-κB signaling pathway.
Notes: Cells were seeded on poly-L-lysine coated dishes and pretreated with PAP (10 μg/mL) for 4 hours. Then, LPS was added to the medium and incubated for another 1 hour. For immunofluorescence analysis, cells were fixed and incubated with primary/secondary antibodies. For Western blotting, cells were lysed and the total/nuclear protein was extracted for further analysis. A significant increase in nuclear translocation of P65 and remarkable upregulation of intranuclear P65 were noticed after 1 hour of LPS application, but this effect was partly abolished by 4 hours of PAP pretreatment (A and B). Consistent with the changes of P65, LPS stimulation increased phosphorylation of IKK in BV2 cells, but it was partly blocked by PAP pretreatment (C and D).
Abbreviations: PAP, papaverine; LPS, lipopolysaccharide; CON, control; DAPI, diamidino-phenyl-indole.
Abbreviations: PAP, papaverine; LPS, lipopolysaccharide; CON, control; DAPI, diamidino-phenyl-indole.