
Figures & data
Table 1 Basic clinical data for AS patients
Figure 1 Fibroblasts were successfully cultured and subcultured regularly by changing the culture medium.
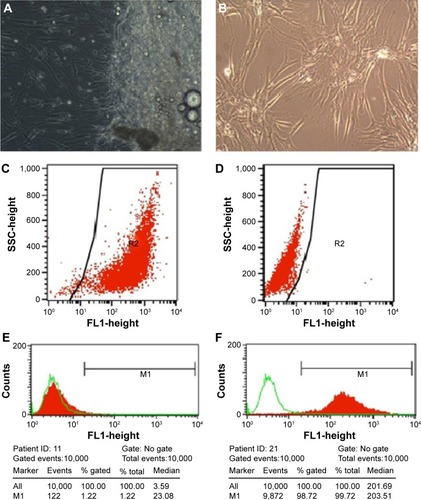
Figure 2 Cell proliferation growth curve treated by various doses of Celastrol, 1.0 μM Indometacin as well as negative controls.
Abbreviation: DMSO, dimethyl sulfoxide.
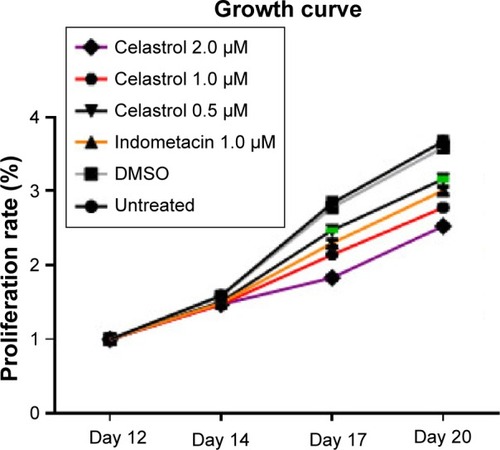
Figure 3 Celastrol inhibits cell proliferation by an MTS assay.
Abbreviations: DMSO, dimethyl sulfoxide; OD, optical density.
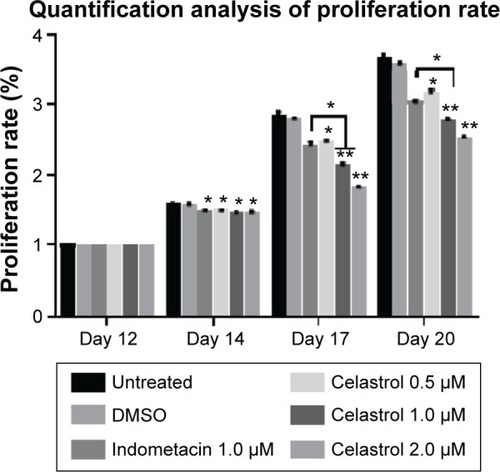
Figure 4 Cell proliferation is measured by performing an EdU incorporation assay on day 14.
Abbreviation: DMSO, dimethyl sulfoxide.
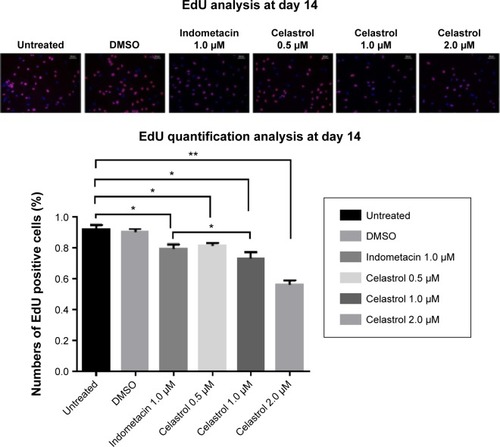
Figure 5 Effect of different doses of celastrol on ALP activity in isolated ankylosing spondylitis fibroblasts compared with indometacin and negative control.
Abbreviations: DMSO, dimethyl sulfoxide; ALP, alkaline phosphatase.
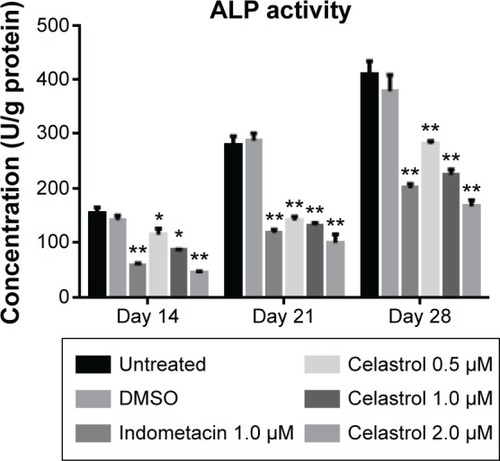
Figure 6 Effect of different doses of celastrol on Alizarin red staining in isolated ankylosing spondylitis fibroblasts compared with indometacin and negative control.
Abbreviation: OD, optical density.
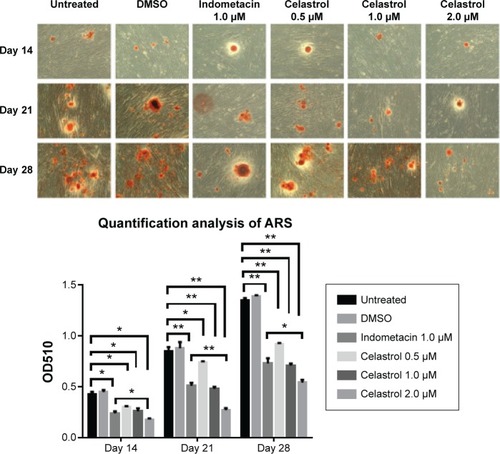
Figure 7 An amount of 1.0 μM celastrol inhibits mRNA expressions of osteogenic genes in prostaglandin E2-induced ankylosing spondylitis fibroblasts compared with untreated control.
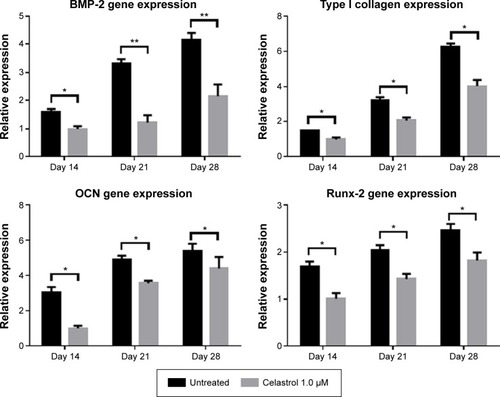
Figure 8 Celastrol (1.0 μM) impacts the expression of related proteins in isolated fibroblasts.
Abbreviation: PGE-2, prostaglandin E2.
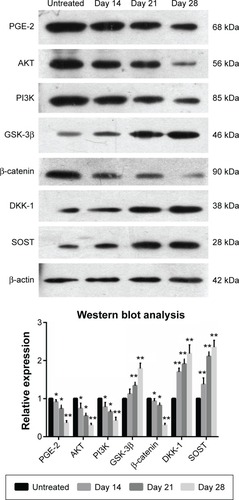
Table S1 Raw Data Of Western Blot Analysis Results with 1.0 μM celastrol compared with untreated group