
Figures & data
Table 1 Baseline and improvement of metabolic parameters by DLBS3233 in comparison with placebo
Table 2 Effects on organ function and weight
Figure 1 Improvement of insulin resistance and β-cell performance in each group.
Notes: (A) Percentage of HOMA-IR reduction from baseline. (B) First-phase insulin level (pmol/L) during OGTT. (C) Second-phase insulin secretion level (pmol/L) during OGTT. P-value resulted from statistical comparisons of delta from baseline, DLBS3233 vs placebo, individually at Week 8 and Week 12. *A significant difference (P<0.05) between groups was found. NS, not statistically significantly different (P>0.05). If a between-group comparison was not significant (P>0.05), the P-value was not mentioned, and only displayed as “NS”. Error bars represent standard error of means.
Abbreviations: HOMA-IR, homeostatic model assessment – insulin resistance; OGTT, oral glucose tolerance test.
Abbreviations: HOMA-IR, homeostatic model assessment – insulin resistance; OGTT, oral glucose tolerance test.
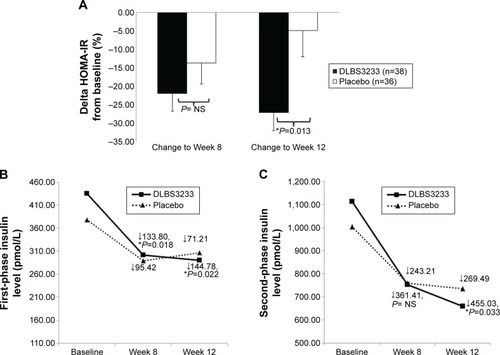
Table 3 Adverse events