Figures & data
Figure 1 The structure of naringenin.
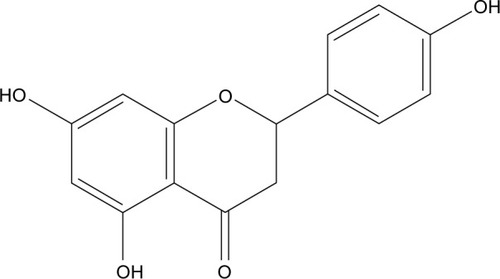
Table 1 Orthogonal factors and levels of preparation of NRG-SLNs
Table 2 Partial solubility parameters and the differences between NRG and lipid materials
Table 3 EE results and analysis of orthogonal experiment of the preparation of NRG-SLNs
Figure 2 Size distribution (A) and zeta potential (B) of NRG-SLNs.
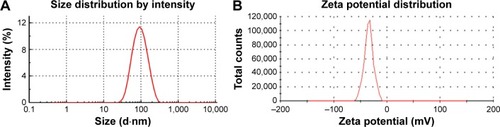
Figure 3 Images of free NRG in water (A), NRG-SLNs suspension (B), and NRG-SLNs suspension via TEM (C).
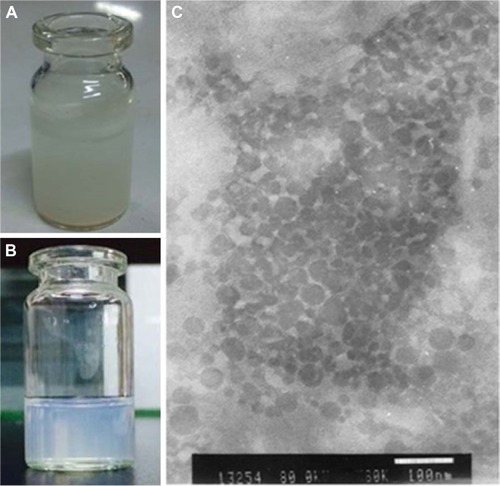
Figure 4 In vitro release profile of NRG from NRG-SLNs and free NRG solution by a dialysis method in phosphate-buffered saline (0.5% of Tween-80 in PBS, pH 7.4) at 37°C.
Abbreviations: NRG, naringenin; SLNs, solid lipid nanoparticles; h, hours; PBS, phosphate buffered saline.
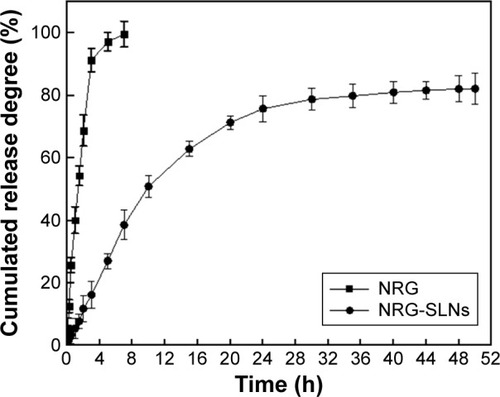
Table 4 The appearance, dissolution time, solution color, and mean particle size of the lyophilization powder of NRG-SLNs
Figure 5 DSC analysis of NRG-SLNs (A), blank-SLNs (B), physical mixture of NRG and blank-SLNs (C), and NRG (D).
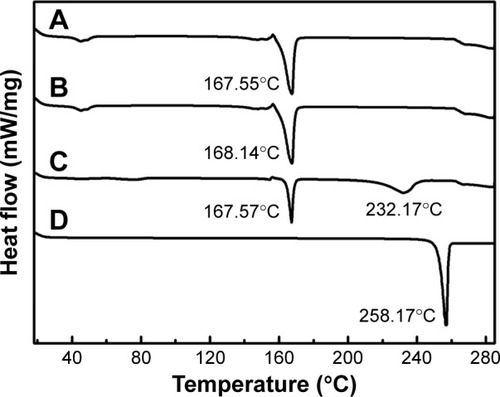
Figure 6 X-ray diffraction patterns of NRG-SLNs (A), blank-SLNs (B), physical mixture of NRG and blank-SLNs (C), GMS (D), and NRG (E).
Abbreviations: NRG, naringenin; SLNs, solid lipid nanoparticles; GMS, glycerol monostearate.
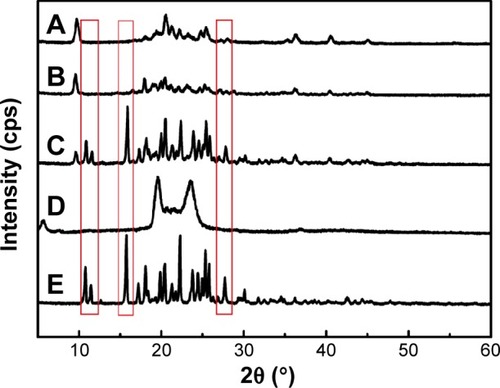
Figure 7 FT-IR spectra of NRG-SLNs (A), blank-SLNs (B), physical mixture of NRG and blank-SLNs (C), and NRG (D).
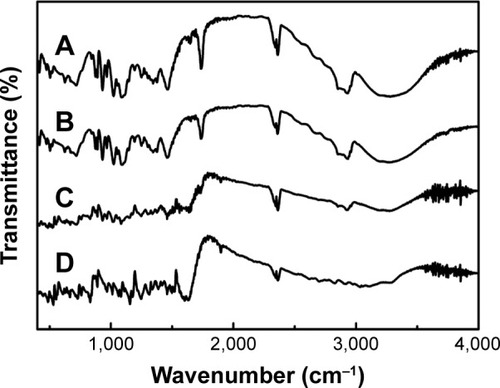
Table 5 Stability studies of NRG-SLN lyophilized powder for 3 months
Figure 8 Cytotoxicity of NRG, blank-SLNs, and NRG-SLNs (n=3).
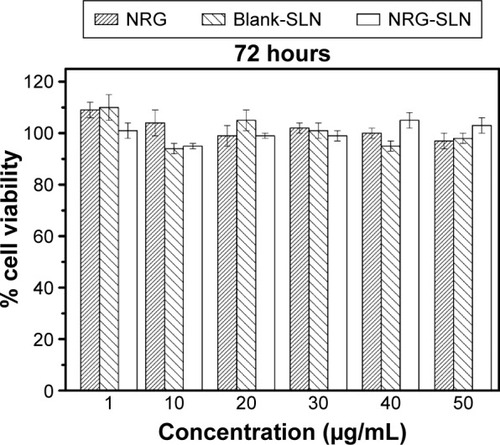
Figure 9 Confocal microscopy images of A549 cells after 1 h, 2 h, and 3 h incubation at 37°C with FITC-SLNs.
Abbreviations: FITC, fluorescein isothiocyanate; SLNs, solid lipid nanoparticles; h, hours.
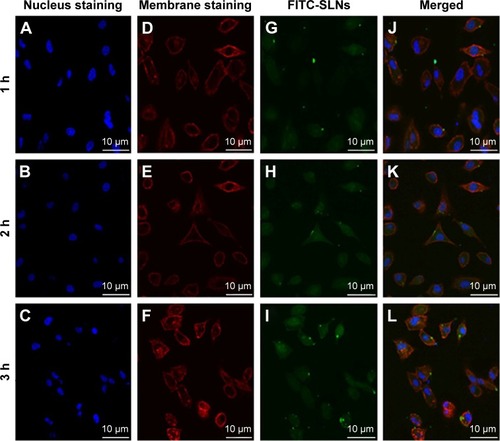
Table 6 Pharmacokinetic parameters of NRG after intratracheal administration of NRG suspension and NRG-SLNs suspension (n=5)
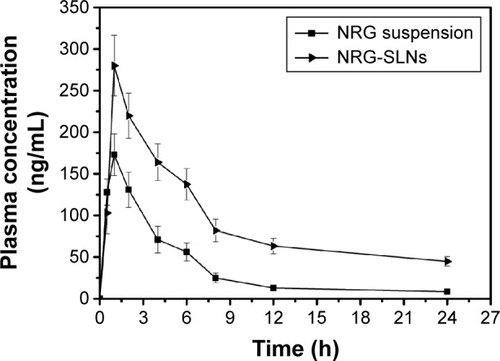
Figure 10 The mean plasma concentration–time curve of NRG in rats after a single intratracheal dose (20 mg/kg) of NRG suspension and NRG-SLNs.
Abbreviations: NRG, naringenin; SLNs, solid lipid nanoparticles; h, hours.