
Figures & data
Table 1 Distribution of demographic data at the beginning of the treatment
Figure 1 Enrollment and randomization flowchart.
Note: Adverse effect: cholecystitis, improbably associated with the test drug.
Abbreviations: KT, ketorolac trometamol; NA, naproxen.
Abbreviations: KT, ketorolac trometamol; NA, naproxen.
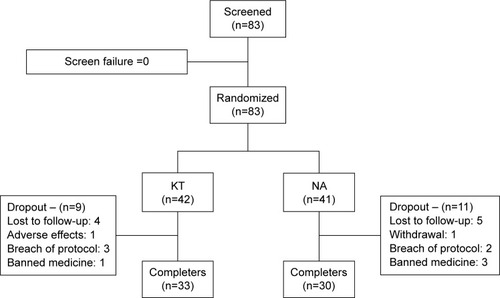
Table 2 RPR as assessed using VAS scores
Table 3 Pain relief as assessed by comparing VAS scores 1 hour before and after receiving medication
Table 4 Efficacy evaluation for investigator ratings of excellent, very good, or good
Figure 2 Pain relief rate 1 hour after medication.
Abbreviation: NA, naproxen.
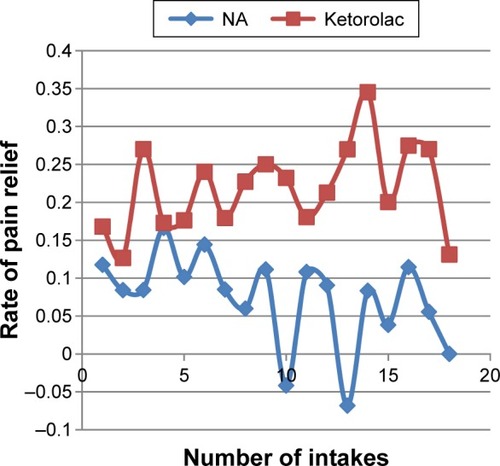
Table 5 Major adverse effects: incidence as a result of treatment in the ITT population
Table 6 Percentage of change in laboratory test results for the protocol population on visits 2 (V2) and 3 (V3) compared with values obtained on the initial visit (V0)