Figures & data
Figure 1 Structures of the analytes and Phase I metabolic pathway of dapoxetine by CYP2D6 enzyme.
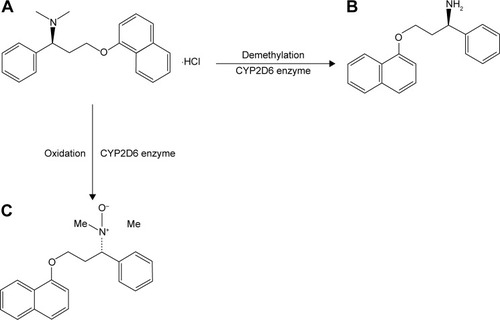
Table 1 Kinetic parameters from demethylation by recombinant wild-type and 24 CYP2D6 allelic variants on dapoxetine
Table 2 Kinetic parameters from oxidational activities of recombinant wild-type and 24 CYP2D6 allelic variants toward dapoxetine
Figure 2 Michaelis–Menten curves of the enzymatic activity of the wild-type and 24 variants toward dapoxetine demethylation (each point represents the mean ± standard deviation of three parallel experiments).
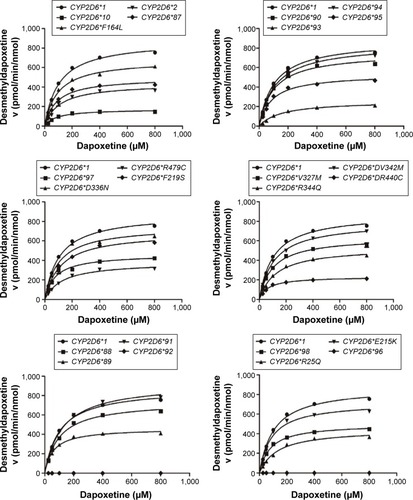
Figure 3 Michaelis–Menten curves of the enzymatic activity of the wild-type and 24 variants toward dapoxetine oxidation (each point represents the mean ± standard deviation of three parallel experiments).
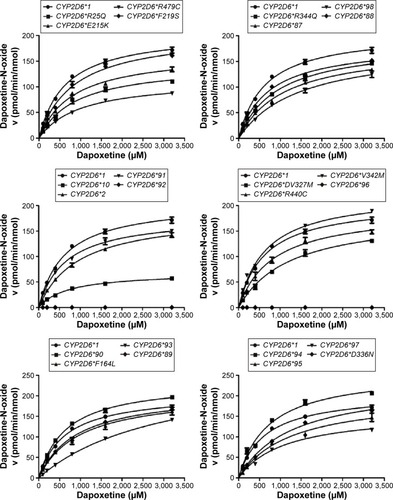
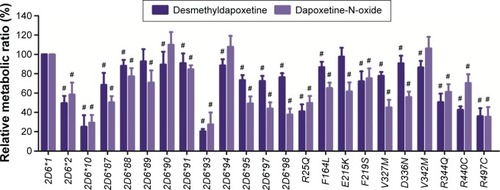
Figure 4 The catalytic activity of expressed CYP2D6 variants toward the two metabolites of dapoxetine, when compared with the counterpart values of the wild-type 2D6*1.