Figures & data
Table 1 The factors and levels discussed in the orthogonal design
Table 2 Results of the orthogonal design
Figure 1 The SEM of spray-drying microspheres.
Abbreviation: SEM, scanning electron microscope.
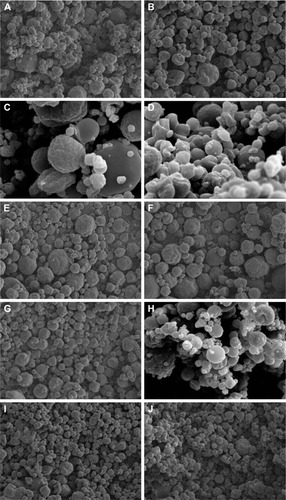
Figure 2 The FTIR spectra of (A) CTS, (B) PL, (C) CTS/PL MS, and (D) CTS/PL/β-CD MS.
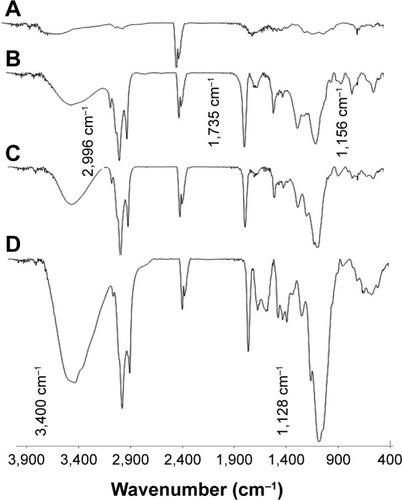
Figure 3 The DSC thermograms of (A) CTS/PL/β-CD microspheres, (B) CTS, (C) PL, and (D) PL/β-CD mixture.
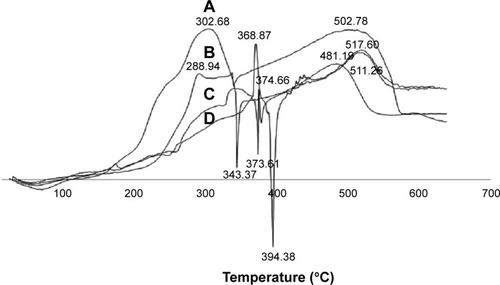
Figure 4 The moisture content of microspheres under different fabrication conditions.
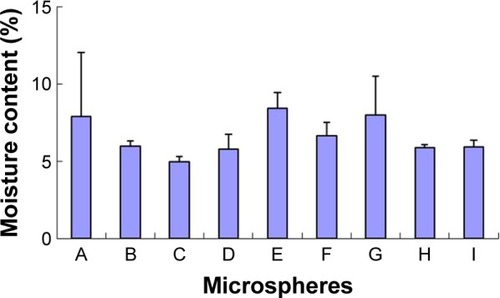
Figure 5 The swelling ratio of microspheres under different fabrication conditions.
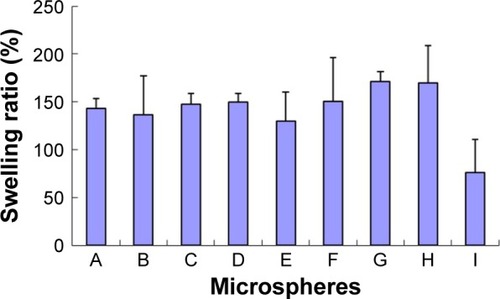
Figure 6 The tapped density of microspheres under different fabrication conditions.
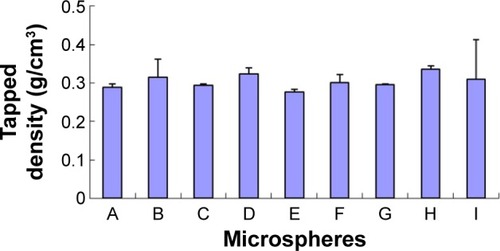
Figure 7 The moisture absorption rates of microspheres under different fabrication conditions.
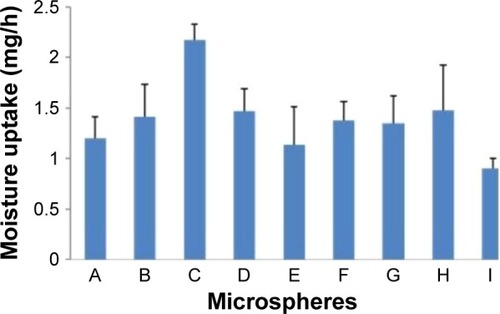
Table 3 Effects of microspheres on escape latency in rats
Table 4 Effects of microspheres on the numbers of crossings over the former location of the platform by rats
Table 5 Effects of microspheres on the expression of PKC-δ and Iba1
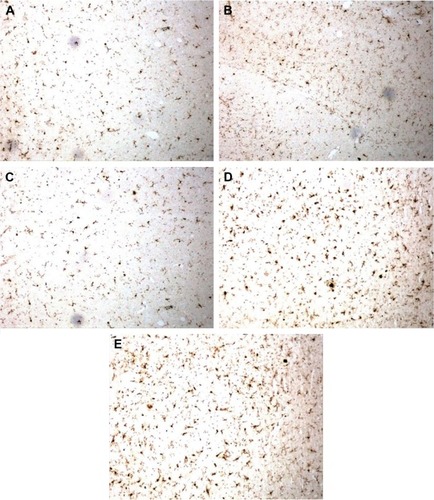
Figure 8 Effects of CTS/PL/β-CD microspheres on the quantities of PKC-δ in the hippocampus by immunohistochemistry staining (light microscope, ×400).
Abbreviations: CTS, chitosan; PL, phospholipid; β-CD, β-cyclodextrin; PKC-δ, protein kinase C-δ.
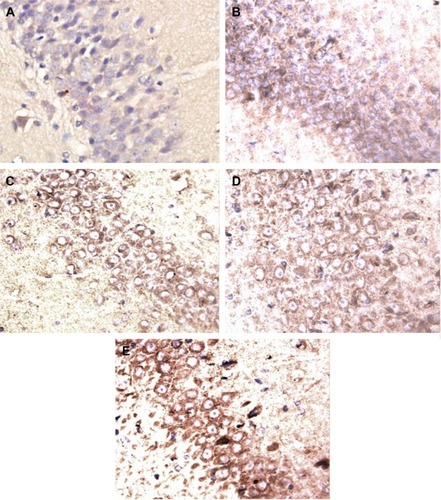
Figure 9 Effects of CTS/PL/β-CD microspheres on the quantities of Iba1 in the hippocampus by immunohistochemistry staining (light microscope, ×400).
Abbreviations: CTS, chitosan; PL, phospholipid; β-CD, β-cyclodextrin; Iba1, ionized calcium-binding adaptor molecule-1.