Figures & data
Table 1 Independent and dependent variables in a central composite experimental design
Table 2 Composition of atorvastatin in situ gel formulations and their observed and predicted responses
Figure 1 Fourier transform infrared spectra of atorvastatin, PEG, PLGA, physical mixture, and the dried in situ gel formulation.
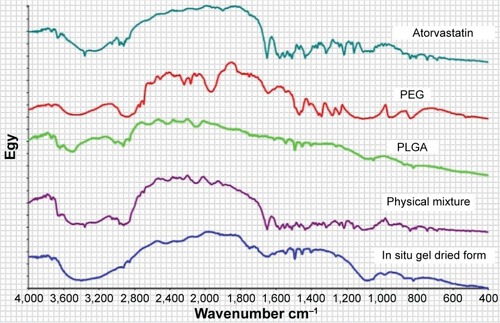
Figure 2 In vitro release profiles for ATR-ISG formulations prepared according to a central composite design.
Abbreviations: ATR, atorvastatin; CCD, central composite design; ISG, in situ gel; PEG, polyethylene glycol; PLGA, poly (d, l-lactide-co-glycolide) acid.
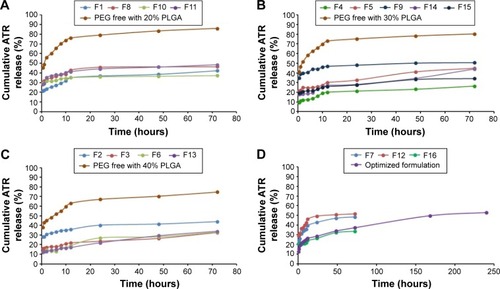
Table 3 Estimated effects of factors, F-ratio, and associated P-values for the initial drug release after 2 hours (Y1) and 24 hours (Y2)
Figure 3 Standardized Pareto charts for the effect of the studied variables on Y1 and Y2.
Abbreviations: PEG, polyethylene glycol; PLGA, poly (d, l-lactide-co-glycolide); X1, PLGA concentration; X2, molecular weight of PEG; X3, concentration of PEG; Y1, initial burst at 2 hours (%); Y2, initial burst at 24 hours (%); X1X1, X2X2, and X3X3 are the quadratic terms for the factors; X1X2, X1X3, and X2X3 are the interaction terms between the factors.
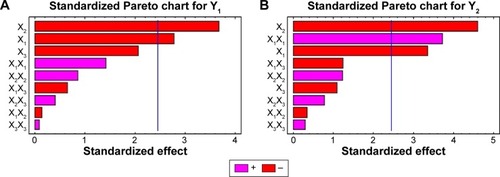
Figure 4 Estimated response surfaces with contour plots (three-dimensional) showing the effect of the studied variables on Y1 and Y2.
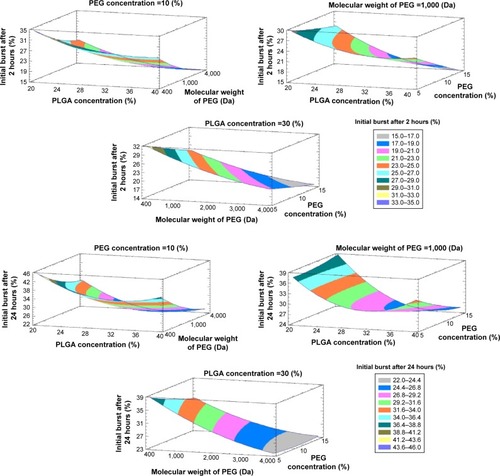
Figure 5 Scanning electron microscopy photomicrographs for ATR-ISG surface: (A) PEG-free formulation and (B) the optimized ATR-ISG formulation.
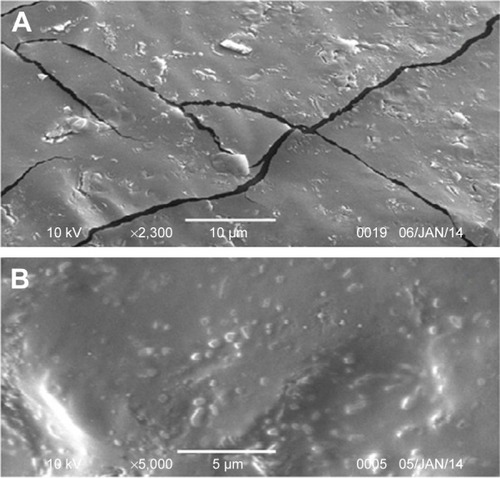
Table 4 Pharmacokinetic parameters after the intramuscular injection of optimized ATR-ISG and PEG-free ATR-ISG in comparison with the oral administration of a single dose (2.5 mg/kg) of the marketed ATR tablet
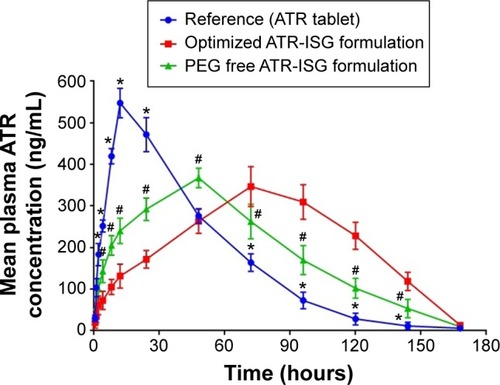
Figure 6 Plasma concentration versus time curve of ATR following the intramuscular injection of optimized ATR-ISG formulation and its corresponding PEG-free ISG system in comparison with the oral administration of the same dose of marketed tablet.
Abbreviations: ATR, atorvastatin; ISG, in situ gel; PEG, polyethylene glycol.