Figures & data
Figure 1 Diagram of CHB patient transition states in the Markov model.
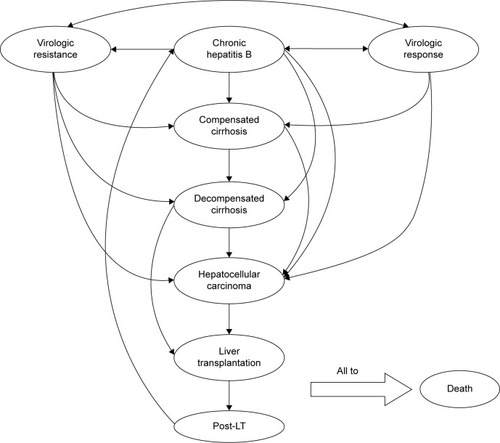
Table 1 Annual transition rates of disease states used in the model (%)
Table 2 Treatment-related annual rates used in the model
Table 3 Annual costs (US dollars, 2014 values) and disease-state utilities
Table 4 Base-case cost and effectiveness of treatment strategies
Figure 2 Ten-year cumulative incidence of advanced liver diseases for HBeAg-positive (A) and -negative (B) CHB patients after different therapy strategies.
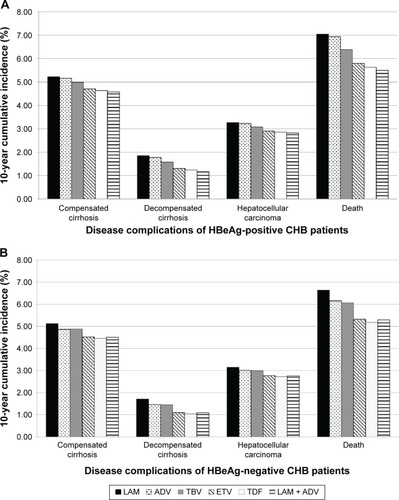
Figure 3 Cost-effectiveness of different treatment strategies for HBeAg-positive (A) and -negative (B) chronic hepatitis B patients.
Abbreviations: LAM, lamivudine; ADV, adefovir; TBV, telbivudine; ETV, entecavir; TDF, tenofovir; QALYs, quality-adjusted life years; HBeAg, hepatitis B e antigen; ICER, incremental cost-effectiveness ratio.
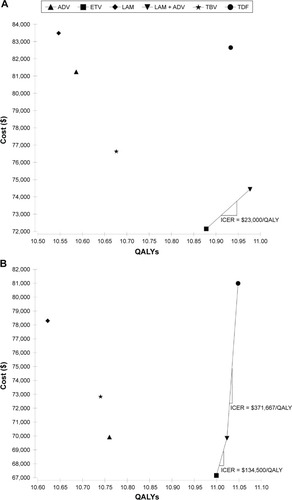
Table 5 Alternative cost and effectiveness of five treatment strategies
Figure 4 Results of one-way sensitivity analysis for HBeAg-positive (A) and -negative (B) CHB patients at a threshold of $20,466/QALY gained.
Abbreviations: LAM, lamivudine; ADV, adefovir; ETV, entecavir; VR, virologic response; HCC, hepatocellular carcinoma; CC, compensated cirrhosis; CHB, chronic hepatitis B; HBeAg, hepatitis B e antigen; QALYs, quality-adjusted life years.
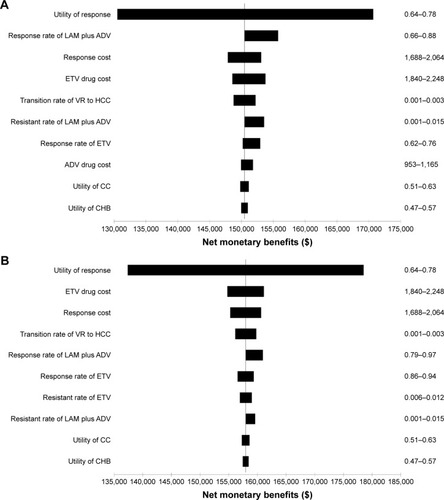
Figure 5 Cost-effectiveness acceptability curves of different strategies for HBeAg-positive (A) and -negative (B) chronic hepatitis B patients.
Abbreviations: ADV, adefovir; ETV, entecavir; LAM, lamivudine; TBV, telbivudine; TDF, tenofovir; HBeAg, hepatitis B e antigen; WTP, willingness-to-pay; QALY, quality-adjusted life year.
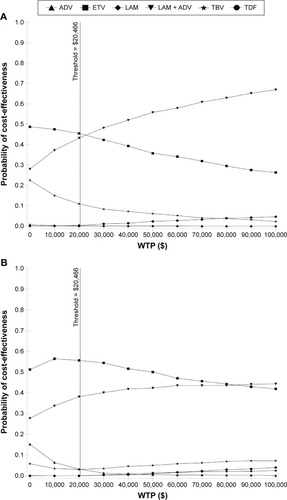
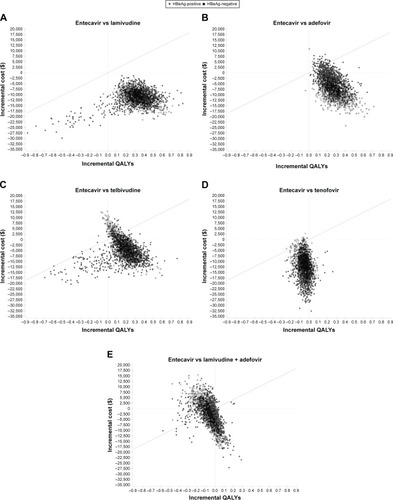
Figure 6 Probabilistic results for incremental cost-effectiveness comparisons between treatment with entecavir and (A) lamivudine monotherapy, (B) adefovir monotherapy, (C) telbivudine monotherapy, (D) tenofovir monotherapy, and (E) lamivudine plus adefovir combination therapy for a simulation involving 1,000 patients.
Abbreviations: QALYs, quality-adjusted life years; ICER, incremental cost-effectiveness ratio.