Figures & data
Table 1 Characteristics of the included RCTs
Figure 1 Flowchart of literature selection process.
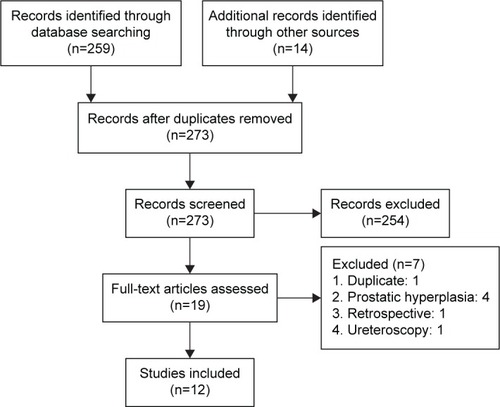
Figure 2 Quality assessment graph.
Note: (+) low risk, (?) unclear risk, (−) high risk.
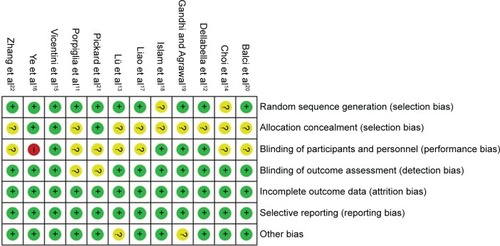
Figure 3 Meta-analysis results of expulsion rate between the groups.
Abbreviations: df, degrees of freedom; M–H, Mantel Haenszel; CI, confidence interval.
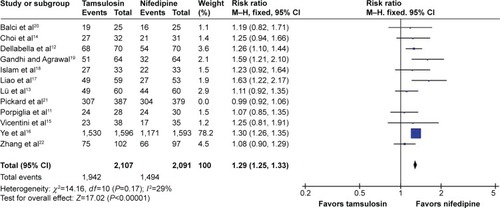
Figure 4 Meta-analysis results of expulsion time between the groups.
Abbreviations: CI, confidence interval; df, degrees of freedom; SD, standard deviation; IV, inverse variance.
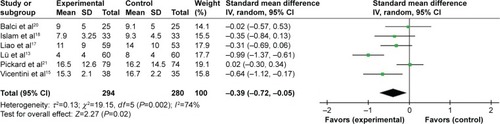
Table 2 Subgroup analysis according to diagnosis of complications
Figure 5 Meta-analysis results of complications between the groups.
Abbreviations: CI, confidence interval; df, degrees of freedom; M–H, Mantel Haenszel.
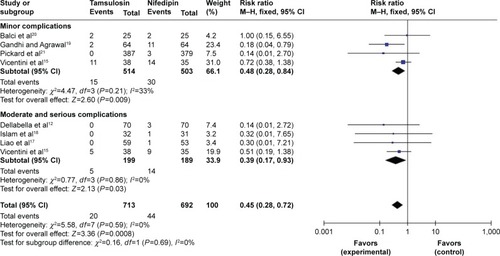
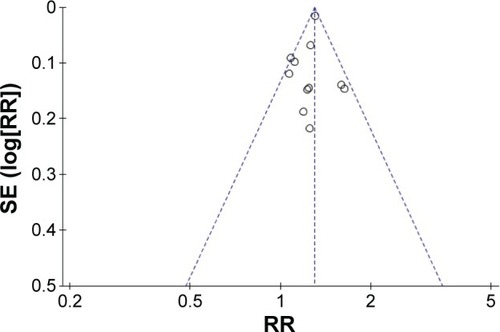
Figure 6 Inverted funnel plot investigating publication bias.
Abbreviations: RR, risk ratio; SE, standard error.