Figures & data
Table 1 Primer sequences used for polymerase chain reactions
Figure 1 Effects of PBS and EGCG on the liver function and pathology of healthy mice.
Notes: (A) The levels of serum ALT and AST in the four groups did not differ. Data are presented as mean ± SD (n=6, P>0.05). (B) Serum levels of TNF-α, IL-6, IL-1β, and IFN-γ in the four groups were evaluated by ELISA (n=6, P>0.05). (C) Representative H&E stained sections of the liver (original magnification, ×200).
Abbreviations: PBS, phosphate-buffered saline; EGCG, epigallocatechin-3-gallate; ConA, concanavalin A; ALT, alanine aminotransferase; AST, aspartate aminotransferase; H&E, hematoxylin and eosin; ELISA, enzyme-linked immunosorbent assay; SD, standard deviation.
Abbreviations: PBS, phosphate-buffered saline; EGCG, epigallocatechin-3-gallate; ConA, concanavalin A; ALT, alanine aminotransferase; AST, aspartate aminotransferase; H&E, hematoxylin and eosin; ELISA, enzyme-linked immunosorbent assay; SD, standard deviation.
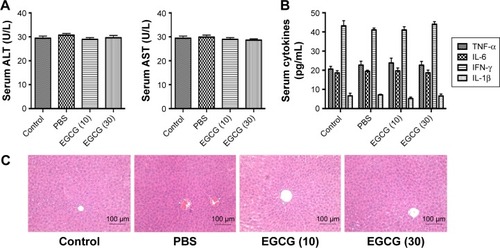
Figure 2 Effects of EGCG on the proliferation and apoptosis of primary hepatocytes induced by ConA.
Notes: (A) The proliferation of primary hepatocytes treated with EGCG before ConA induction was detected using CCK8. (B) The apoptosis of primary hepatocytes was determined by flow cytometry (n=3, *P<0.05 for ConA versus PBS, +P<0.05 for ConA + EGCG versus ConA). (C) The mRNA levels of Beclin-1, P62, LC3, Bcl-2, and Bax in primary hepatocytes were detected by qRT-PCR (n=3, *P>0.05 for EGCG versus PBS, #P<0.05 for ConA versus PBS, +P<0.05 for ConA + EGCG versus ConA). (D) The mRNA levels of IL-6, JAK1, JAK2, and BNIP3 in primary hepatocytes were detected by qRT-PCR (n=3, *P>0.05 for EGCG versus PBS, #P<0.05 for ConA versus PBS, +P<0.05 for ConA + EGCG versus ConA). (E) The protein levels of Beclin-1, LC3, P62, Bcl-2, and Bax in primary hepatocytes were detected by Western blot. (F) The protein expression of IL-6, JAK1, p-STAT3, STAT3, and BNIP3 in primary hepatocytes was determined by Western blot.
Abbreviations: EGCG, epigallocatechin-3-gallate; ConA, concanavalin A; PBS, phosphate-buffered saline; SD, standard deviation; qRT-PCR, quantitative real-time polymerase chain reaction.
Abbreviations: EGCG, epigallocatechin-3-gallate; ConA, concanavalin A; PBS, phosphate-buffered saline; SD, standard deviation; qRT-PCR, quantitative real-time polymerase chain reaction.
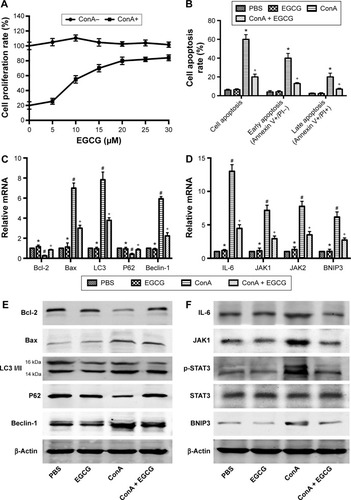
Figure 3 Effects of EGCG on liver function and pathology of mice with ConA-induced acute hepatitis.
Notes: (A) The levels of serum ALT and AST changed depending on the EGCG dose, 10 or 30 mg/kg. Data are presented as mean ± SD (n=8, *P<0.05 for PBS versus ConA, #P<0.05 for ConA + EGCG [10] versus ConA, +P<0.05 for ConA + EGCG [30] versus ConA). (B) The necrotic and edematous area stained with H&E and used for the liver sections was analyzed with Image-Pro Plus 6.0 (original magnification, ×200). The results show statistically significant differences between the groups (n=8, *P<0.05 for ConA versus PBS, #P<0.05 for ConA + EGCG [10] versus ConA).
Abbreviations: ALT, alanine aminotransferase; AST, aspartate aminotransferase; H&E, hematoxylin and eosin; EGCG, epigallocatechin-3-gallate; ConA, concanavalin A; SD, standard deviation; PBS, phosphate-buffered saline.
Abbreviations: ALT, alanine aminotransferase; AST, aspartate aminotransferase; H&E, hematoxylin and eosin; EGCG, epigallocatechin-3-gallate; ConA, concanavalin A; SD, standard deviation; PBS, phosphate-buffered saline.
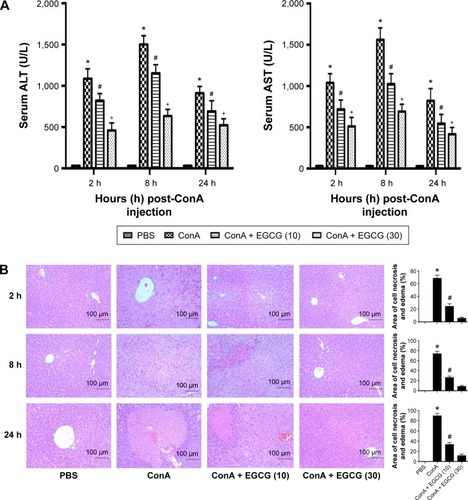
Figure 4 Effects of EGCG on the production of TNF-α, IL-6, IL-1β, and IFN-γ in mice with ConA-induced acute hepatitis.
Notes: (A) Plasma TNF-α, IL-6, IL-1β, and IFN-γ, measured by ELISA, was reduced by EGCG pretreatment in mice at doses of 10 and 30 mg/kg. Data are presented as mean ± SD (n=8, *P<0.05 for PBS versus ConA, #P<0.05 for ConA + EGCG [10] versus ConA, +P<0.05 for ConA + EGCG [30] versus ConA). (B) The mRNA levels of TNF-α, IL-6, IL-1β, and IFN-γ were evaluated in each group by qRT-PCR (n=8, *P<0.05 for PBS versus ConA, #P<0.05 for ConA + EGCG [10] versus ConA, +P<0.05 for ConA + EGCG [30] versus ConA). (C) Protein expression of TNF-α, IL-6, IL-1β, and IFN-γ was detected by Western blotting. (D) Immunohistochemistry was used to detect TNF-α and IL-6 (original magnification, ×200). The IODs of the different indices are expressed as mean ± SD (n=8, *P<0.05 for PBS versus ConA, #P<0.05 for ConA + EGCG [10] versus ConA).
Abbreviations: EGCG, epigallocatechin-3-gallate; ConA, concanavalin A; IODs, integrated optical densities; PBS, phosphate-buffered saline; SD, standard deviation; qRT-PCR, quantitative real-time polymerase chain reaction; ELISA, enzyme-linked immunosorbent assay.
Abbreviations: EGCG, epigallocatechin-3-gallate; ConA, concanavalin A; IODs, integrated optical densities; PBS, phosphate-buffered saline; SD, standard deviation; qRT-PCR, quantitative real-time polymerase chain reaction; ELISA, enzyme-linked immunosorbent assay.
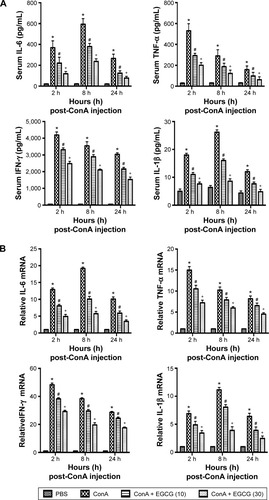
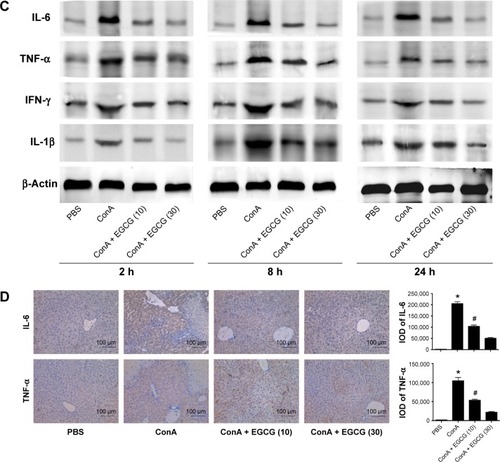
Figure 5 Effects of EGCG on apoptosis and autophagy in mice with ConA-induced acute hepatitis.
Notes: (A) The mRNA levels of Bcl-2, Caspase-3, Caspase-9, LC3, P62, and Beclin-1 were measured by qRT-PCR (n=8, *P<0.01 for PBS versus ConA, #P<0.05 for ConA + EGCG [10] versus ConA, +P<0.05 for ConA + EGCG [30] versus ConA). (B) Protein expression of Bcl-2, Bax, Caspase-3, Caspase-9, LC3 I/II, P62, and Beclin-1 was detected with Western blotting. (C) Immunohistochemistry was used to detect Bcl-2, Bax, LC3 II and Beclin-1 (original magnification, ×200). The IODs of the different indices are expressed as mean ± SD (n=8, *P<0.05 for PBS versus ConA, #P<0.05 for ConA + EGCG [10] versus ConA, +P<0.05 for ConA + EGCG [30] versus ConA). (D) TUNEL staining showed apoptotic cells in three groups at 8 hours (×200). The percentage of TUNEL-positive cells are expressed as mean ± SD (n=8, *P<0.05 for PBS versus ConA, #P<0.05 for ConA + EGCG [10] versus ConA, +P<0.05 for ConA + EGCG [30] versus ConA). (E) Autophagosome formation was detected in liver tissues with TEM at 8 hours (original magnification, ×10,000). Arrows indicate autophagosomes.
Abbreviations: EGCG, epigallocatechin-3-gallate; ConA, concanavalin A; IODs, integrated optical densities; PBS, phosphate-buffered saline; SD, standard deviation; qRT-PCR, quantitative real-time polymerase chain reaction; TEM, transmission electron microscopy.
Abbreviations: EGCG, epigallocatechin-3-gallate; ConA, concanavalin A; IODs, integrated optical densities; PBS, phosphate-buffered saline; SD, standard deviation; qRT-PCR, quantitative real-time polymerase chain reaction; TEM, transmission electron microscopy.
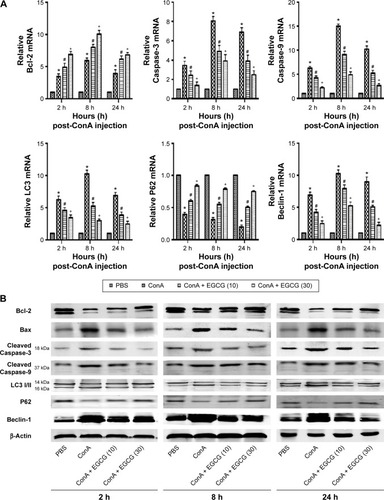
Figure 6 Effects of EGCG on regulation of the JAKs/STAT3/BNIP3 pathway in mice with ConA-induced acute hepatitis.
Notes: (A) The mRNA levels of JAK1, JAK2, and BNIP3 were determined by qRT-PCR (n=8, *P<0.05 for PBS versus ConA, #P<0.05 for ConA + EGCG [10] versus ConA, +P<0.05 for ConA + EGCG [30] versus ConA). (B) Protein expression of JAK1, JAK2, STAT3, p-STAT3, and BNIP3 was detected by Western blotting. (C) Immunohistochemistry was used to detect JAK1, JAK2, p-STAT3, and BNIP3 (original magnification, ×200). The IODs of the different indices are expressed as mean ± SD (n=8, *P<0.05 for PBS versus ConA, #P<0.05 for ConA + EGCG [10] versus ConA).
Abbreviations: EGCG, epigallocatechin-3-gallate; ConA, concanavalin A; IODs, integrated optical densities; PBS, phosphate-buffered saline; SD, standard deviation; qRT-PCR, quantitative real-time polymerase chain reaction; h, hour.
Abbreviations: EGCG, epigallocatechin-3-gallate; ConA, concanavalin A; IODs, integrated optical densities; PBS, phosphate-buffered saline; SD, standard deviation; qRT-PCR, quantitative real-time polymerase chain reaction; h, hour.
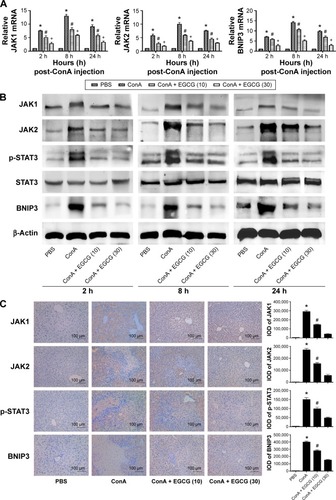
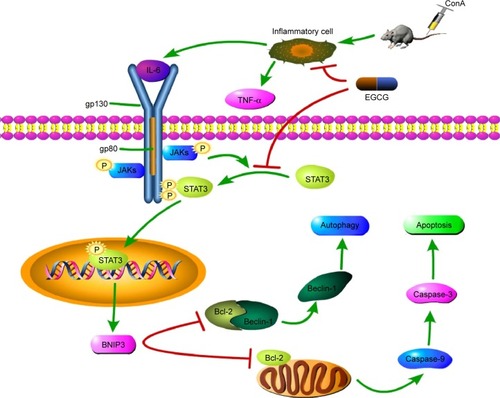
Figure 7 Mechanism of EGCG action.
Notes: In ConA-induced autoimmune hepatitis, EGCG reduces autophagy by inhibiting the IL-6/JAKs/STAT3/BNIP3 pathway. IL-6, a proinflammatory cytokine, was overexpressed by inflammatory cells after ConA injection, combined with its receptor, followed by the JAK kinases phosphorylation of STAT3. Phosphorylated-STAT3 translocates to the nucleus and increases the expression of BNIP3. BNIP3 interacts with Beclin-1/Bcl-2 complexes by binding to Bcl-2, resulting in free Beclin-1, leading to autophagy, while the BNIP3/Bcl-2 complex reduces the antiapoptotic effects of Bcl-2, promoting the release of Caspase-9 and Caspase-3, causing apoptosis. Thus, EGCG successfully inhibits the release of IL-6 in inflammatory cells during acute liver injury and reduces apoptosis and autophagy by reducing the phosphorylation of STAT3.
Abbreviations: EGCG, epigallocatechin-3-gallate; ConA, concanavalin-A; IL-6, interleukin-6.
Abbreviations: EGCG, epigallocatechin-3-gallate; ConA, concanavalin-A; IL-6, interleukin-6.