Figures & data
Figure 1 The HPLC chromatograms of TSD.
Abbreivations: HPLC, high-performance liquid chromatography; TSD, total saponin of Dioscoreae hypoglaucae Palibin.
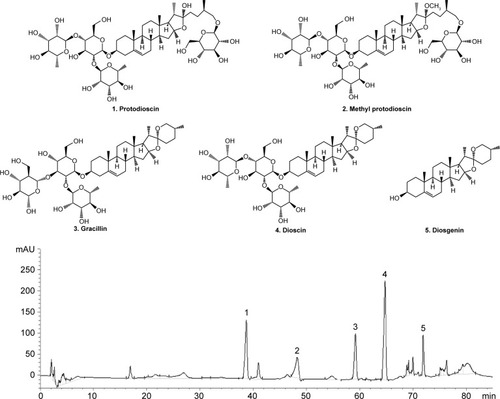
Figure 2 Schematic diagram of the induction and treatment schedule of diabetic rats.
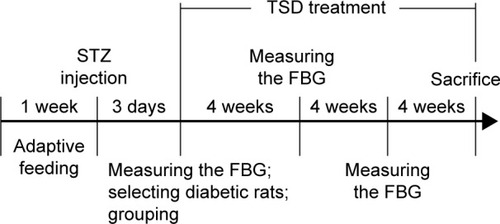
Table 1 Effects of different treatments on FBG in diabetic rats
Figure 3 Effect of TSD on GHb in diabetic rats.
Abbreviations: GHb, glycosylated hemoglobin; NC, normal control group; DC, diabetic control group; Met, metformin hydrochloride group; TSD, total saponin of Dioscorea hypoglaucae Palibin.
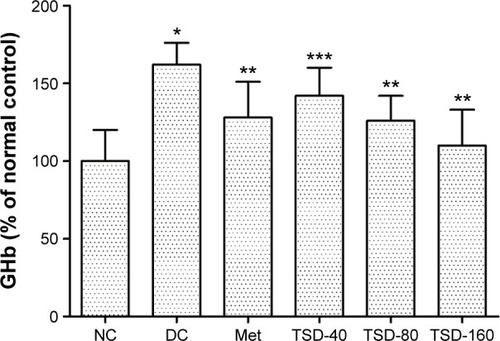
Table 2 Effect of TSD on kidney index, BUN, serum Cr, CCR, and urine protein in diabetic rats
Figure 4 Representative micrographs of kidney tissue stained with hematoxylin–eosin.
Abbreviations: NC, normal control group; DC, diabetic control group; Met, metformin hydrochloride group; TSD, total saponin of Dioscorea hypoglaucae Palibin.
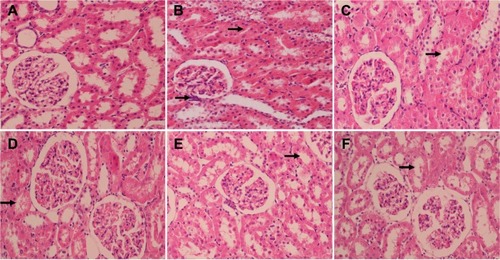
Figure 5 Representative micrographs of kidney tissue stained with periodic acid–Schiff.
Abbreviations: NC, normal control group; DC, diabetic control group; Met, metformin hydrochloride group; TSD, total saponin of Dioscorea hypoglaucae Palibin.
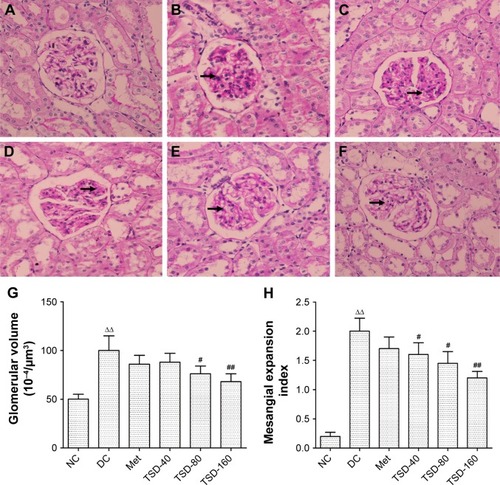
Figure 6 Effect of TSD on renal immunohistochemical stain of collagen IV in diabetic rats.
Abbreviations: IOD, integrated optical density; NC, normal control group; DC, diabetic control group; Met, metformin hydrochloride group; TSD, total saponin of Dioscorea hypoglaucae Palibin.
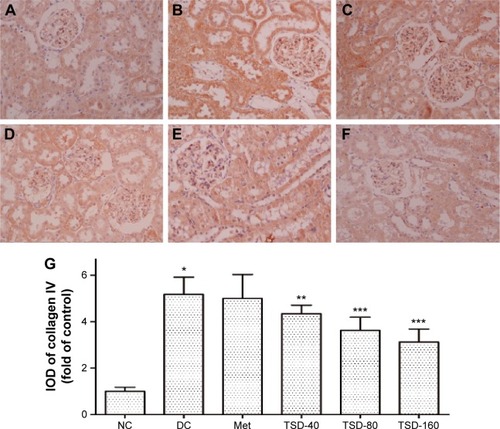
Table 3 Effect of TSD on renal SOD, CAT, GSH-Px, and MDA levels in diabetic rats
Table 4 Effect of TSD on renal TGF-β1, CTGF, TNF-α, IL-1β, and IL-6 levels in diabetic rats
Figure 7 Effect of TSD on renal immunohistochemical stain of AGEs in diabetic rats.
Abbreviations: AGEs, advanced glycation end products; IOD, integrated optical density; NC, normal control group; DC, diabetic control group; Met, metformin hydrochloride group; TSD, total saponin of Dioscorea hypoglaucae Palibin; SD, standard deviation.
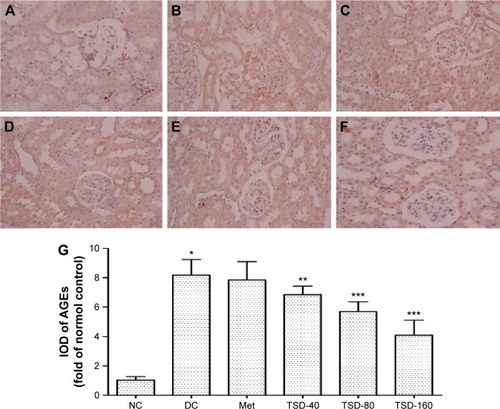
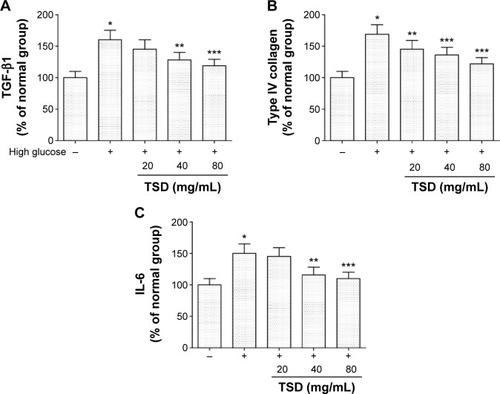
Figure 8 Effects of TSD on TGF-β1 (A), type IV collagen (B), and IL-6 (C) in vitro.
Abbreviations: IL-6, interleukin-6; TGF-β1, transforming growth factor-β1; TSD, total saponin of Dioscorea hypoglaucae Palibin; SD, standard deviation.