Figures & data
Figure 1 Preparation of the tissue for the bleb analysis.
Notes: (A) The bleb was cut above the plate along the midline (asterisk) corresponding to the axis of the tube. (B) The cross section just in the middle portion of the bleb was analyzed. The sections on both sides along the midline were used for the analysis.
Abbreviation: AGV, Ahmed glaucoma valve.
Abbreviation: AGV, Ahmed glaucoma valve.
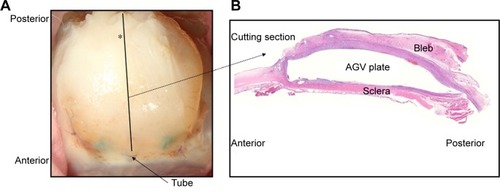
Figure 2 Histologic micrographs (H&E staining) of bleb surrounding the endplate after glaucoma drainage device implantation.
Notes: (A) Virgin conjunctiva, Tenon’s capsule, and sclera. The degree of cellularity in the total bleb was lower in the pirfenidone group than in the control group at 2 weeks post operation (P=0.005, B). (C–H) Bleb after glaucoma drainage device implantation. FBGCs (arrow) were observed in the inner bleb near the endplate at 4 weeks post operation (I) and around the suture material at 2 weeks after operation (J). The number of FBGCs was not different between the two groups (K). Scale bars: 1,000 μm, 200 μm within the box (A); 2 mm (C–H), 100 μm (C–H, right upper part); 50 μm (I, J). *A significant difference with P<0.05 compared to control rats.
Abbreviations: AGV, Ahmed glaucoma valve; CE, conjunctival epithelium; FBGCs, foreign body giant cells; H&E, hematoxylin and eosin; S, sclera; TC, Tenon’s capsule.
Abbreviations: AGV, Ahmed glaucoma valve; CE, conjunctival epithelium; FBGCs, foreign body giant cells; H&E, hematoxylin and eosin; S, sclera; TC, Tenon’s capsule.
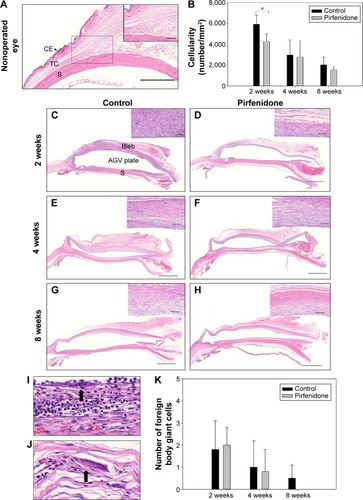
Figure 3 Bleb fibrosis represented by Masson’s trichrome staining.
Notes: In the nonoperated eye, Masson’s trichrome stain showed loosely arranged tenon’s tissue stained weakly, and sclera stained intensely blue (A). The height (arrow) of the collagen-stained innermost layer in the bleb was measured, and the mean height was calculated from five height measurements (B). Pirfenidone treatment decreased the thickness of the inner fibrous layer at 4 weeks and 8 weeks post operation (P=0.031 and P=0.022, respectively; C–G). The collagen-stained area was less in the pirfenidone group than in the control group at 8 weeks post operation (P=0.027; H). The pirfenidone group showed a lower density of collagen deposition than the control group at 8 weeks post operation (P=0.026; I). Scale bars: 500 μm (A); 2 mm (B); 500 μm (C–F). *A significant difference with P<0.05 compared to control rats.
Abbreviations: CE, conjunctival epithelium; S, sclera; TC, Tenon’s capsule.
Abbreviations: CE, conjunctival epithelium; S, sclera; TC, Tenon’s capsule.
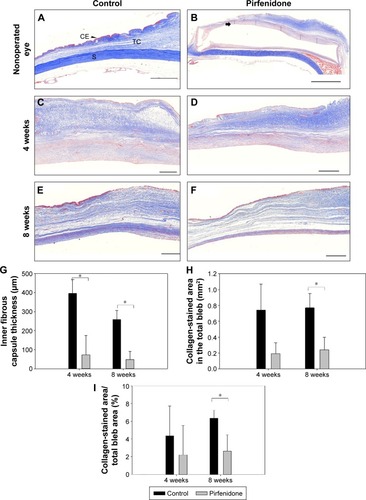
Figure 4 Immunohistochemical micrographs for cell division in the bleb.
Notes: Nonoperated conjunctiva, Tenon’s capsule, and sclera revealed no positive staining for anti-PCNA (A). For total blebs, the percentage of PCNA-expressing cells was lower in the pirfenidone group than in the control group at 2 weeks post operation (P=0.022; B–E, J). At 4 weeks after operation, the difference between the two groups was not significant (P=0.820; F–J). For inner blebs, the proportion of PCNA-expressing cells was less in the pirfenidone group than in the control group at 2 weeks post operation (P=0.036; K). Scale bars: 100 μm (A); 2 mm (B, C, F, G); 200 μm (D, E, H, I). *A significant difference with P<0.05 compared to control rats.
Abbreviations: CE, conjunctival epithelium; PCNA, proliferating cell nuclear antigen; S, sclera; TC, Tenon’s capsule.
Abbreviations: CE, conjunctival epithelium; PCNA, proliferating cell nuclear antigen; S, sclera; TC, Tenon’s capsule.
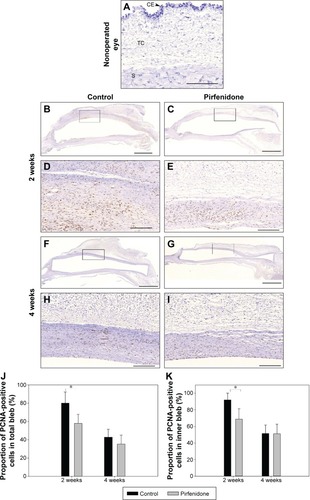
Figure 5 Immunohistochemical micrographs for CTGF.
Notes: CTGF scarcely stained the normal Tenon’s capsule in the nonoperated eye (A). CTGF immunostaining was positive throughout the bleb, especially in the inner bleb area in both groups (B–I). Pirfenidone treatment decreased CTGF expression compared with the control group at 2 weeks after GDD implantation (P=0.029, total bleb [J]; P=0.018, inner bleb [K]). Scale bars: 200 μm (A); 2 mm (B, C, F, G); 200 μm (D, E, H, I). *A significant difference with P<0.05 compared to control rats.
Abbreviations: CE, conjunctival epithelium; CTGF, connective tissue growth factor; GDD, glaucoma drainage device; TC, Tenon’s capsule.
Abbreviations: CE, conjunctival epithelium; CTGF, connective tissue growth factor; GDD, glaucoma drainage device; TC, Tenon’s capsule.
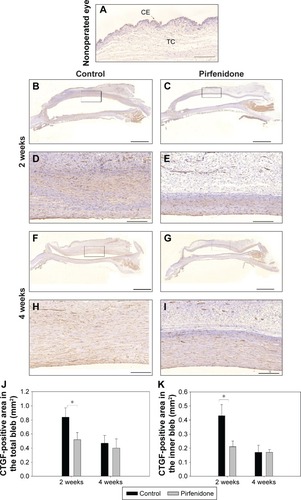
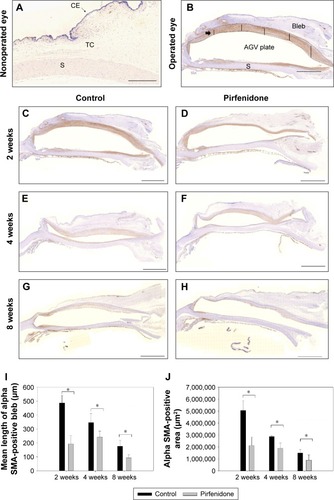
Figure 6 Immunohistochemical micrographs for transition from fibroblasts to myofibroblasts.
Notes: No anti-α-SMA immunostaining was visible in virgin conjunctiva and sclera (A). The mean of five height values (arrow) and the total area of the α-SMA immunostained bleb were measured (B). Immunostaining for α-SMA was greatest in the inner portion of the bleb from 2 weeks to 8 weeks post operation in the pirfenidone (D, F, H) and control (C, E, G) groups. The height (I) and area (J) of α-SMA expression were lower in the pirfenidone group compared to the control group at 8 weeks post operation (all P<0.05). Scale bars: 500 μm (A); 2 mm (B–H). *A significant difference with P<0.05 compared to control rats.
Abbreviations: AGV, Ahmed glaucoma valve; CE, conjunctival epithelium; S, sclera; SMA, smooth muscle actin; TC, Tenon’s capsule.
Abbreviations: AGV, Ahmed glaucoma valve; CE, conjunctival epithelium; S, sclera; SMA, smooth muscle actin; TC, Tenon’s capsule.