Figures & data
Figure 1 Effects of PPARγ2 Pro12Ala variant on lipid droplet accumulation and 3T3-L1 preadipocyte differentiation after DHA treament. Lv-vector, Lv-PPARG2 or Lv-PPARG2 P12A-transfected 3T3-L1cells were pretreated and differentiated in the absence or presence of different concentrations of DHA. (A) Oil Red O staining was performed to examine cell morphology. (B) The lipid droplets were dissolved in 100% isopropanol, and the color intensity was measured at 500 nm using a spectrophotometer. OD values are expressed as the means ± SEM of 3 samples. *p < 0.05.
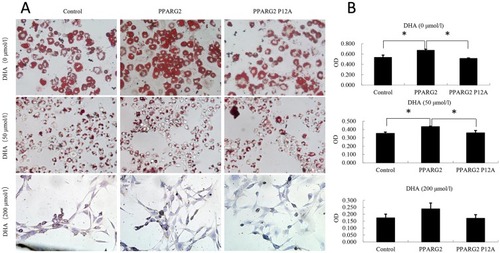
Figure 2 Effects of different concentrations of DHA on apoptosis of adipocytes of different genotypes. 3T3-L1 preadipocytes of different genotypes were prepared in the absence or presence of different concentrations of DHA. (A) TUNEL detection was performed to observe adipocyte apoptosis level. The excitation wavelength ranged from 450 to 500 nm, whereas the emission wavelength ranged from 515 to 565 nm (green fluorescence). (B) Adipocyte apoptosis ratios was calculated. Values are expressed as the mean ± SEM of 3 samples. *p < 0.05.
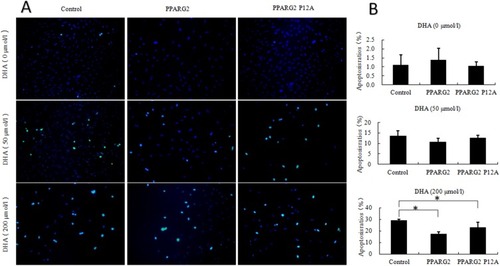
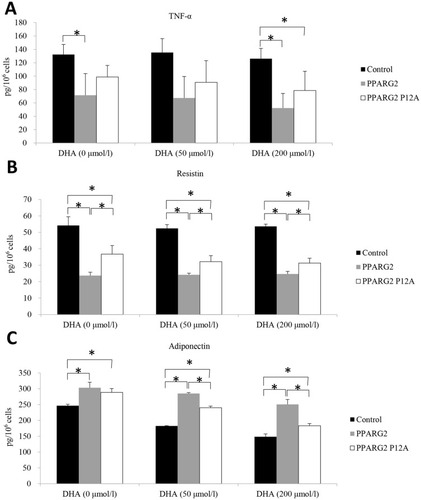
Figure 3 Effects of different genotypes on the secretory functions of adipocytes. The samples were analyzed for determination of the protein levels of TNF-α (A), resistin (B), and adiponectin (C) by ELISA. Values are expressed as the mean ± SEM. *p < 0.05.