Figures & data
Figure 1 Successful establishment of type 1 diabetic nephropathy mice model induced by streptozotocin (STZ) for 4 weeks. (A) Flow chart of the mice model in this study. Blood glucose (B), body weight (C), 24 hrs urine volume (D), kidney weight index (E), and 24 hrs urine albumin excretion (F) were measured at day 0 and day 28 in three groups of wild-type non-diabetic mice (WT-control), wild-type mice with STZ-induced diabetes (WT-DN), A1AR-knockout mice with STZ-induced diabetes (KO-DN)). Blood glucose ≥16.7 mmol/L at 72 hrs after STZ-induction was defined to diagnose diabetes. Compared to WT-control mice, WT-DN and KO-DN mice showed significantly increased blood glucose, urine volume, kidney weight index and 24 hrs urine albumin excretion with decreased bodyweight, indicating successful type 1 diabetic nephropathy induction at fourth week. (N=6 per group,*P<0.05, #P<0.01).
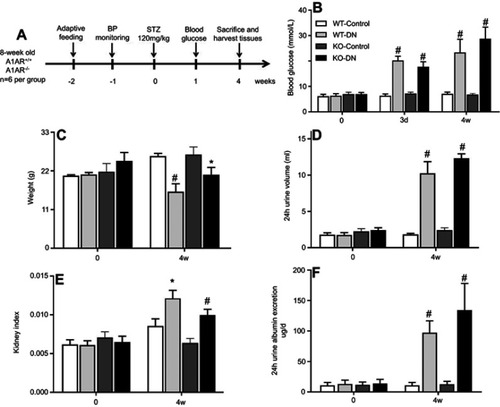
Figure 2 Representative images of renal histopathological change and tubular basement membrane. (A and B) Histopathological change in three groups (WT-control, WT-DN and KO-DN) at four weeks visualized by HE staining (A): Mild glomerulomegaly and brush border damage in proximal tubular epithelial cells, as typically for diabetic nephropathy, were shown in the WT-DN group while not in the WT-control group (P=0.023). Compared to the WT-DN mice group, KO-DN developed more severe glomerulomegaly (P=0.003), renal tubular hypertrophy and vacuolization (Original magnification =200×, 400× magnification reveals glomerulus and proximal renal tubule in black boxed area in 200×. Bar width =200 μm). The black arrows in panel B indicates P=0.023 (WT-DN VS WT-Control), P=0.003 (KO-DN VS KO-Control), P=0.005(KO-DN VS WT-DN). (C). Electron microscopy showed the typical changes in the early stage of DN that is thickening of the renal tubular basement membrane. The thickness in control groups was 110–130 nm, and that in groups with DN was 220–280 nm (Original magnification =25000×. Bar width =500 nm). The red arrows showed the tubular basement membrane.
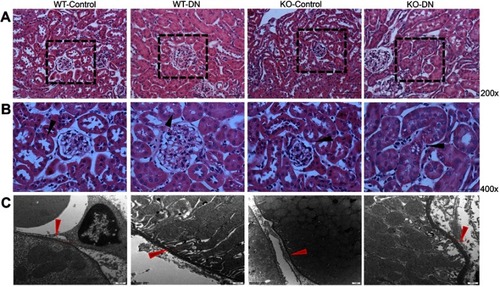
Figure 3 A1 adenosine receptor (A1AR) deletion aggravated renal tubular microvilli, megalin-cubillin loss, and albuminuria in DN mice. (A and B) Transmission electron microscope showed shortened length and reduced density tubular microvilli in DN mice compared to control mice, further shorter and more sparse density were observed in KO-DN mice than WT-DN mice. (A: Original magnification =10,000×. Bar width =1 μm; B: Original magnification =25,000×. Bar width =500 nm). (C and D). Immunohistochemical staining showed both megalin (C) and cubilin (D) expression decreased sequentially in WT-control, WT-DN, and A1AR knock out (KO)-DN mice at 4 weeks (100× magnification). (E) Semiquantitative analysis confirmed that down-regulation of megalin and cubilin expression was significant. (F) Compared to WT-DN, A1AR deletion aggravated urine albumin excretion (UAE) in KO-DN. (G). Level of UAE was negatively correlated with megalin (black dotted line) and cubilin (red solid line) relative expression. Red arrows in panels B showed microvilli of proximal tubular brush border. Black arrows in panels C and D showed megalin loss area of diabetes mice. Data were analyzed by the positive area proportion of megalin and cubilin at proximal tubules, and data were presented as mean ± SEM (N=6 per group). Bar width =100px.
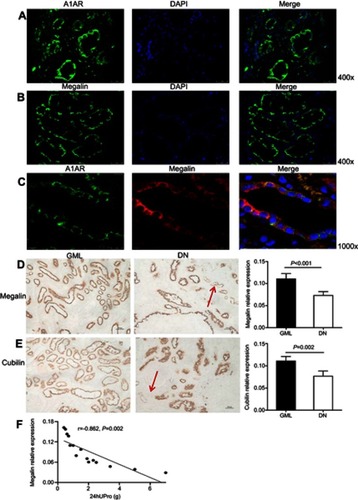
Figure 4 Expression of megalin, cubilin, and A1 adenosine receptor (A1AR) in kidneys of DN patients. (A) A1AR was located at the membrane of PTC by immunofluorescent staining. Green: A1AR; Blue: DAPI; Merge is A1AR with DAPI. (B) Megalin was visualized at the brush border of proximal tubular cells (PTC) in patients with diabetic nephropathy (DN) by immunofluorescent staining. Green: megalin; Blue: DAPI, Merge is megalin with DAPI. (C) Showed the coexpression of A1AR and megalin at PTC. Green: A1AR; Red: megalin; Blue: DAPI; Merge is A1AR with megalin. (D–E) Semiquantitative analysis of immunohistochemical staining showed the positive area of both megalin and cubilin expression decreased significantly in DN patients compared to that in GML patients. (F) Negative association of megalin positive expression area and 24 hrs urine protein in DN patients. Data are presented as the Mean ± SEM (n=12 per group). Bar width: 25 μm. The red arrows in panels D and E were megalin loss area.
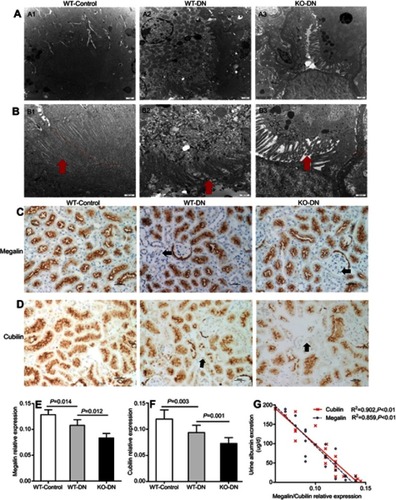
Figure 5 A1 adenosine receptor (A1AR) deletion aggravated diabetes-induced renal inflammation by activation caspase-1 and interleukin (IL)-18. (A). A1AR activation was observed in WT-DN mice, compared to WT-control mice by Western blotting. (C–D). Showed caspase-1/IL-18 protein expression by Western blotting and their quantification. Compared to WT-control, analyzed protein expression increased in WT-DN mice, while further more increasing in A1AR knockout (KO)-DN mice than in WT-DN mice. Data are shown as Mean ± SEM; n=6 per group.
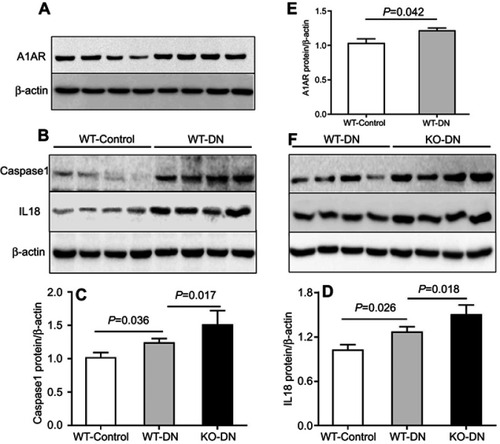
Figure 6 The role of A1AR antagonist DPCPX and agonist CCPA in caspase-1/IL18 activation and megalin loss in HK2 cell cocultured with high glucose. (A–B). Protein expression of caspase-1, IL-18, and megalin in high glucose, high glucose with DPCPX and CCPA by Western blotting. Quantitative analysis of caspase-1 (C), IL-18 (D), and megalin (E). Showed the upregulation of caspase-1/IL-18 and downregulation of megalin expression in high glucose. DPCPX further increased caspase-1/IL-18 expression and decreased megalin expression. However, CCPA inhibited caspase-1/IL-18 expression and improved megalin loss obviously. Data are shown as Mean ± SEM; *P<0.05 HG+DPCPX vs HG, #P<0.01 HG vs NG, **P<0.05 HG+CCPA vs HG. n=4 per group.
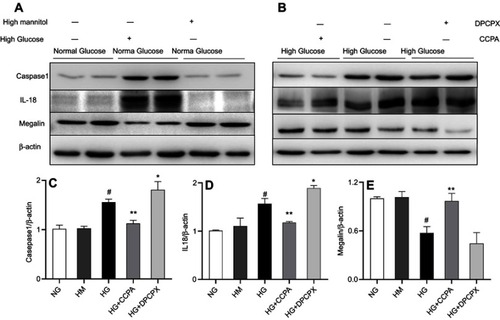
Figure 7 Model of the possible pathway in this study: Hyperglycemia could stimulate the increased production of adenosine, accompanied with high expression of its A1 receptor (A1AR), which widely distributes in renal proximal tubular epithelial cells. A1AR plays an anti-inflammatory role in megalin-cubilin loss by inhibiting pyroptosis related caspase-1/IL-18 signaling.
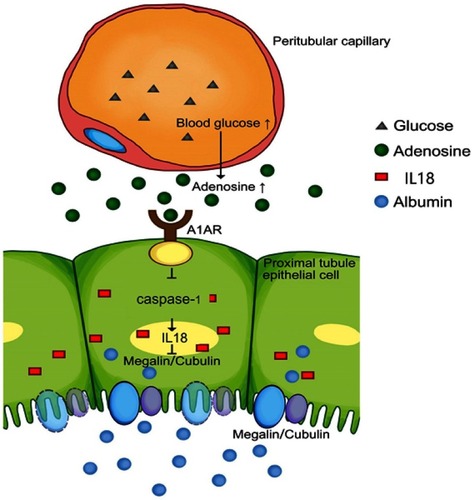
Table S1 Reagents used in this study
Table S2 Baseline characteristics of DN patients in biopsy
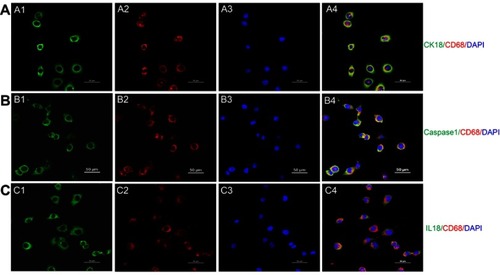
Figure S1 Transdifferentiation of proximal tubular epithelial cell to macrophage in a high glucose environment. (A) Costaining of PTC immunolabeled by cytokeratin (CK)-18 and macrophage immunolabelled by CD68. Green: cytokeratin (CK)-18; Red: CD68; Blue: DAPI; Merge is CK18 with CD68. (B) Costaining of pyroptosis signaling immunolabeled by caspase-1 and macrophage immunolabeled by CD68. Green: Caspase-1; Red: CD68; Blue: DAPI; Merge is caspase-1 with CD68. (C) Costaining of pyroptosis signaling immunolabeled by IL18 and macrophage immunolabeled by CD68Green: IL-18; Red: CD68; Blue: DAPI; Merge is IL-18 with CD68. Original magnification =400x. Bar width =50 μm.