Figures & data
Figure 1 The timeline of study.
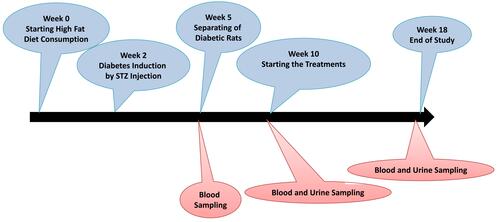
Figure 2 UAER (A) and ACR (B) in each group.
Notes: Significant differences between the healthy and DKD control groups have been specified by square (#) meaning P-value <0.05. Significant differences between DKD and BCc1-treated groups are specified by (*) meaning P-value <0.05.
Abbreviations: UAER, 24-h urinary albumin excretion rate; ACR, urinary albumin-to-creatinine ratio; H, healthy control; DKD, diabetic kidney disease control; LDB, low dose of BCc1; MDB, medium dose of BCc1; HDB, high dose of BCc1.
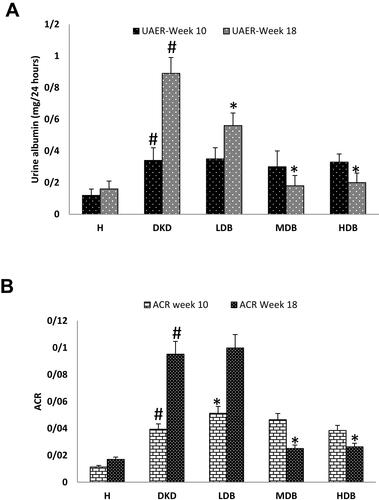
Figure 3 Plasma FBS changes (A), Cr (B), uric acid (C), BUN (D) in each group. Plasma concentration of AST and ALT (E) and HOMA-IR index (F) in each group at the end of study.
Notes: Significant differences between the healthy and DKD control groups are specified by square (#) meaning P-value <0.05. Significant differences between DKD and BCc1-treated groups are specified by (*) meaning P-value <0.05.
Abbreviations: FBS, fasting blood glucose; BUN, blood urea nitrogen; Cr, creatinine; AST, aspartate aminotransferase; ALT, alanine aminotransferase; HOMA-IR index, homeostasis model assessment of insulin resistance index; H, healthy control; DKD, diabetic kidney disease control; LDB, low dose of BCc1; MDB, medium dose of BCc1; HDB, high dose of BCc1.
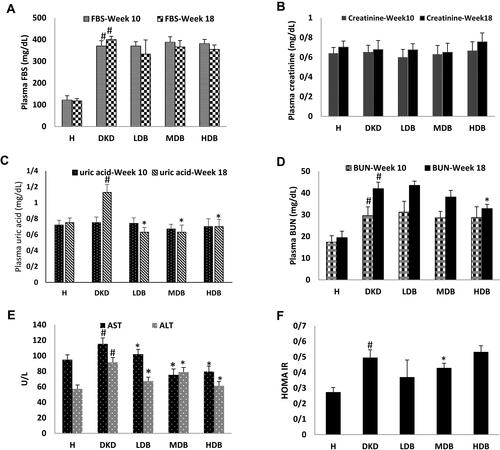
Figure 4 CBC count analysis.
Notes: Significant differences between the healthy and DKD control groups are specified by square (#) meaning P-value <0.05.
Abbreviations: RBC, red blood cell; Hb, hemoglobin; MCV, mean cell volume; Hct, hematocrit; H, healthy control; DKD, diabetic kidney disease control; LDB, low dose of BCc1; MDB, medium dose of BCc1; HDB, high dose of BCc1.
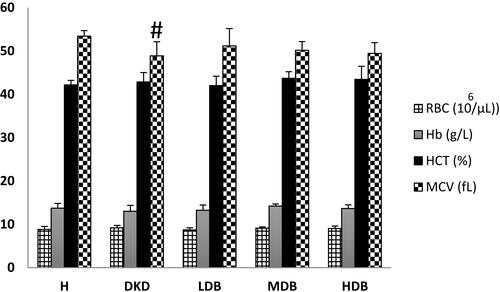
Figure 5 Urine MDA (A) and 8-isoprostane (B).
Notes: Significant differences between the healthy and DKD control groups are specified by square (#) meaning P-value <0.05. Significant differences between DKD and BCc1-treated groups are specified by (*) meaning P-value <0.05.
Abbreviations: MDA, malondialdehyde; H, healthy control; DKD, diabetic kidney disease control; LDB, low dose of BCc1; MDB, medium dose of BCc1; HDB, high dose of BCc1.
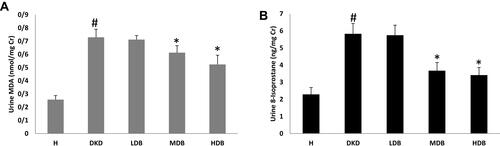
Figure 6 Liver iron content in each group.
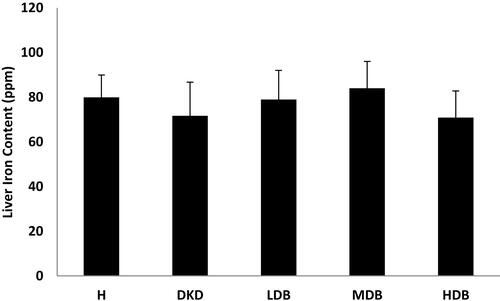
Table 1 Scoring the Histopathological Observations
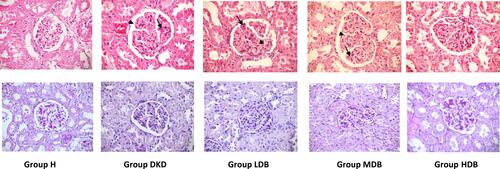
Figure 7 H&E and PAS images from kidney of rats in different groups.
Note: The arrows show mesangial expansion and hyper-cellularity and the arrow heads show GBM wrinkling and thickening.
Abbreviations: H, healthy control; DKD, diabetic kidney disease control; LDB, low dose of BCc1; MDB, medium dose of BCc1; HDB, high dose of BCc1.