Figures & data
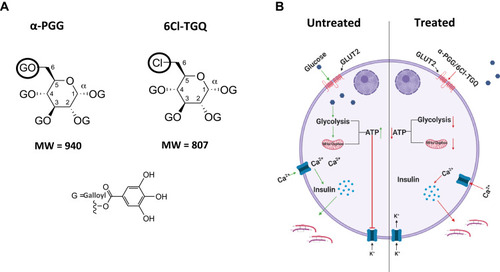
Figure 1 α-PGG and 6Cl-TGQ reduced glucose-stimulated insulin secretion (GSIS) in a concentration-dependent manner. Isolated mouse islets were treated with either α-PGG (A) or 6Cl-TGQ (B) at 0, 5, 10, 20, 40, and 60µM in low glucose (2.5mM) or high glucose (16mM) GSIS assays. Thirty minutes after the treatment, assay media were collected and measured for the secreted insulin, then normalized by cell protein contents. For each condition, 10 islets in triplicate were used. Data are expressed as means ± SEM. (C) Studies were repeated on INS-1832/13 cells using a dose of 40 µM for each compound. Data are expressed as means ± SEM. *p<0.05, **p<0.01, ***p<0.001.
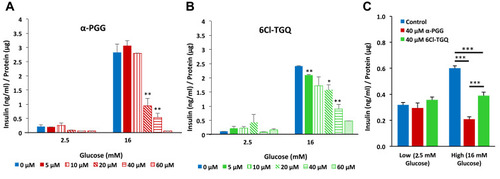
Figure 2 The insulin receptor antagonist S961 failed to block the inhibitory effects of the compounds on glucose-stimulated insulin secretion (GSIS). INS-1832/13 cells were exposed to low (2.5mM) and high (16mM) glucose along with either (A) 40µM α-PGG, 40µM α-PGG ± 100nM S961, or S961 alone or (B) 6CL-TGQ, 6CL-TGQ + 100nM S961, or S961 alone. (C and D) Islets isolated from CD-1 mice were exposed to the same conditions described for α-PGG in (A) and for 6Cl-TGQ in (B), respectively. For each condition, 20 islets in triplicate were used. Data are expressed as means ± SEM, N. S. = not significant *P<0.05, ***p<0.001.
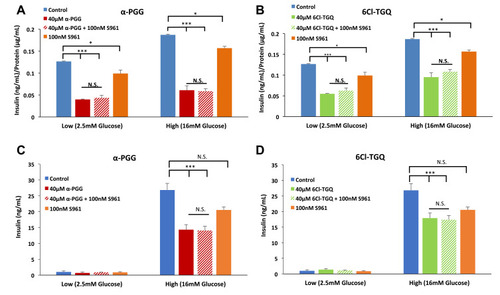
Figure 3 α-PGG and 6Cl-TGQ reduced glucose-stimulated intracellular calcium [Ca2+]i response. (A and C) [Ca2+]i traces showing effects of 5-min exposure to α-PGG (A) and 6CI-TGQ (C) in 16mM glucose. (B and D) Mean intracellular calcium ± SEM before (con), during (drug), and after (wash) exposure to α-PGG (B) and 6CI-TGQ (D). N=10–15 islets were used for testing each compound. N.S. = not significant, **P<0.01. ***P<0.001.
![Figure 3 α-PGG and 6Cl-TGQ reduced glucose-stimulated intracellular calcium [Ca2+]i response. (A and C) [Ca2+]i traces showing effects of 5-min exposure to α-PGG (A) and 6CI-TGQ (C) in 16mM glucose. (B and D) Mean intracellular calcium ± SEM before (con), during (drug), and after (wash) exposure to α-PGG (B) and 6CI-TGQ (D). N=10–15 islets were used for testing each compound. N.S. = not significant, **P<0.01. ***P<0.001.](/cms/asset/b2a12f31-ea6a-4a27-b482-6ff032bb3455/dmso_a_12182371_f0003_c.jpg)
Figure 4 Modulating insulin receptor signaling had no effect on [Ca2+]i or on the inhibitory effects of α-PGG and 6Cl-TGQ. (A) [Ca2+]i traces showing effects of 5-min exposure to 100nM insulin in 16mM glucose. (B) Mean intracellular calcium ± SEM before (con), during (drug), and after (wash) exposure to insulin. Studies as described in (A and B) are shown for the insulin receptor antagonist S961 (C and D), α-PGG in the presence of S961 (E and F), and 6Cl-TGQ (G and H). N=10–15 islets were used for testing each compound. N.S. = not significant, **P<0.01. ***P<0.001.
![Figure 4 Modulating insulin receptor signaling had no effect on [Ca2+]i or on the inhibitory effects of α-PGG and 6Cl-TGQ. (A) [Ca2+]i traces showing effects of 5-min exposure to 100nM insulin in 16mM glucose. (B) Mean intracellular calcium ± SEM before (con), during (drug), and after (wash) exposure to insulin. Studies as described in (A and B) are shown for the insulin receptor antagonist S961 (C and D), α-PGG in the presence of S961 (E and F), and 6Cl-TGQ (G and H). N=10–15 islets were used for testing each compound. N.S. = not significant, **P<0.01. ***P<0.001.](/cms/asset/00a27b99-e647-4adc-bbec-ed429e6e97d9/dmso_a_12182371_f0004_c.jpg)
Figure 5 Effects of α-PGG and 6Cl-TGQ on rates of glycolysis, mitochondrial OXPHOS, and ATP/ADP ratio in rat INS-1832/13 cells. INS-1832/13 cells were treated with 40 µM of either α-PGG or 6Cl-TGQ and subjected to either the Seahorse metabolic analyses. (A and B) Effects of α-PGG and 6Cl-TGQ treatment on ECAR (glycolysis rate) in INS-1832/13 cells, respectively. (C and D) Effects of α-PGG and 6Cl-TGQ treatment on OCR (OXPHOS) in INS-1832/13 cells. (E) Mitochondrial stress test of α-PGG and 6Cl-TGQ. Vertical lines in the graph indicate times for addition of compound and mitochondrial inhibitors. (F) Effects of α-PGG and 6Cl-TGQ treatment on ATP/ADP ratio. Data are expressed as means ± SEM, N=3–6, *p<0.05, **p<0.01, ***p<0.001.
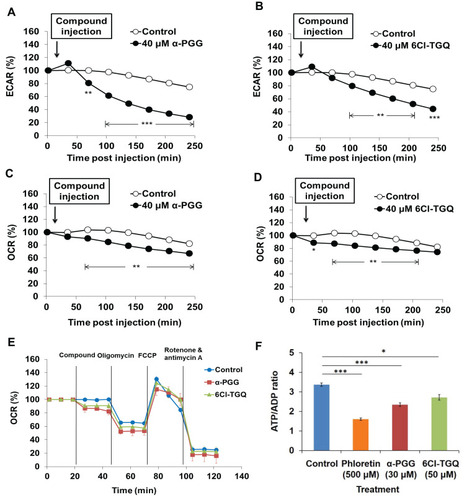
Figure 6 α-PGG and 6Cl-TGQ diminished glucose transport in rat INS-1832/13 cells. Pancreatic INS-1832/13 cells treated with α-PGG or 6Cl-TGQ were subjected to a glucose uptake assay. After addition of compound and [3H] 2-deoxy-D-glucose, treated cell lines were lysed and were measured for their respective retained radioactivity. (A) α-PGG inhibited glucose uptake in INS-1832/13 cells. (B) 6Cl-TGQ inhibited glucose uptake in INS-1832/13 cells. (C) Insulin had no inhibitory effects on glucose uptake, whereas 30μM α-PGG and 40μM 6Cl-TGQ reduced glucose uptake to ~40% of control rates. Data are expressed as means ± SEM, N=3–6, *p<0.05. N.S. = not significant.
![Figure 6 α-PGG and 6Cl-TGQ diminished glucose transport in rat INS-1832/13 cells. Pancreatic INS-1832/13 cells treated with α-PGG or 6Cl-TGQ were subjected to a glucose uptake assay. After addition of compound and [3H] 2-deoxy-D-glucose, treated cell lines were lysed and were measured for their respective retained radioactivity. (A) α-PGG inhibited glucose uptake in INS-1832/13 cells. (B) 6Cl-TGQ inhibited glucose uptake in INS-1832/13 cells. (C) Insulin had no inhibitory effects on glucose uptake, whereas 30μM α-PGG and 40μM 6Cl-TGQ reduced glucose uptake to ~40% of control rates. Data are expressed as means ± SEM, N=3–6, *p<0.05. N.S. = not significant.](/cms/asset/31cb2671-023b-429d-88b2-2c4721168f1e/dmso_a_12182371_f0006_c.jpg)
Figure 7 α-PGG and 6Cl-TGQ did not affect cell viability. Treatments of α-PGG or 6Cl-TGQ at various compound concentrations for 24h do not alter cell viability of INS-1832/13 cells. Phloretin used as a positive control for cell death. Data are expressed as means ± SEM, N=3–6, ***p<0.001.
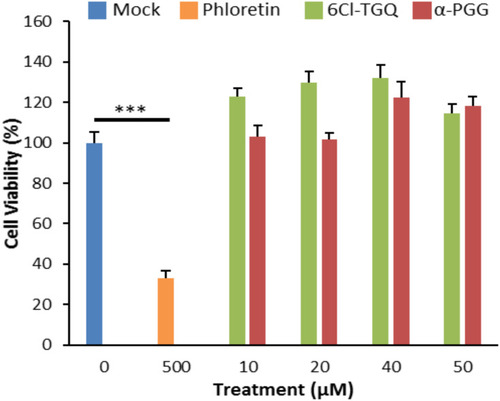
Figure 8 A hypothetical model explains the effects of PGG/TGQ on GSIS. (A) Structures of PGG and TGQ are included to show their relatively large molecular weights and their polarity with hydrophilic features and tendency of extracellularly functioning. (B) Model. Left, normal (untreated) GSIS in beta-cells. Right, beta-cells treated with α-PGG/6Cl-TGQ, resulting in reduced GSIS. See Discussion section for the detailed explanation of the mechanism underlying the action of the compounds.