Figures & data
Table 1 Biometric Data
Table 2 Body, Organ, and Tissue Weights
Table 3 Total Polyphenolic Contents
Figure 1 Intraperitoneal glucose tolerance test. (A) Glucose tolerance test, (B) correlation between fasting blood glucose levels and fluid intake per day.
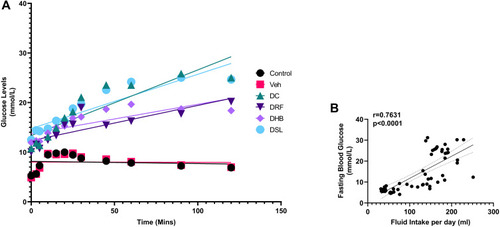
Figure 2 Protein expression of phospho and total ERK1/2. (A) individual phospho: total ERK1/2, (B) p/tERK1/2 at a glance, (C) probed blot. *p<0.05 vs control. n, 4–5.
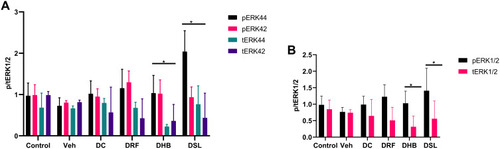
Figure 3 Protein expression of total IRS-1 and IRS-2. (A) Ratio of IRS1 to IRS 2, (B) probed blot. n=4–5.
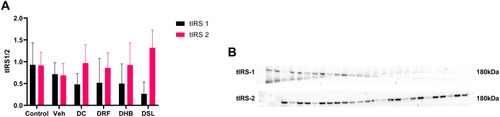
Figure 4 Total protein expression of PkB/Akt. (A) Graph of PkB/Akt, (B) probed blot of PkB/Akt. Values in bracket () denotes percentage change versus DC. n=4–5.
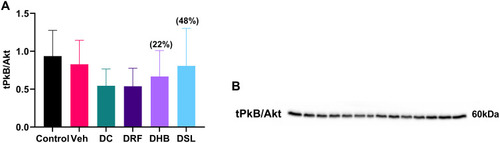
Figure 5 Total protein expression of GLUT4. (A) Graph showing tGLUT4, (B) probed blot. Values in bracket () denotes percentage change versus DC. n=4–5.
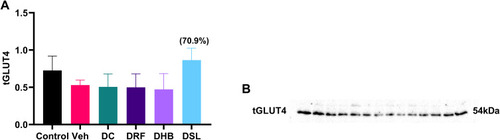
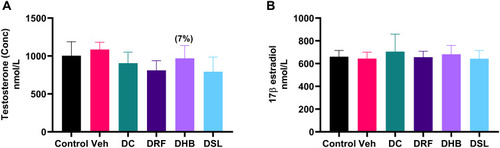
Figure 6 Plasma levels of testosterone and estradiol. (A) Testosterone, (B) estradiol. Values in bracket () denotes percentage change versus DC. n=4–5.