
Figures & data
Table 1 Socio-Demographic, Lifestyle, and Clinical Characteristics of the Participants (n=266)
Table 2 Prevalence of Metabolic Syndrome and Its Components Stratified by Sex (n = 266)
Table 3 The Distribution of MetS Among the Participants Stratified by Sex (n=266)
Figure 1 Variation of different metabolic disorders with BMI cutoffs among the participants (n = 266).
Abbreviations: BP, blood pressure; BMI, body mass index; FBG, fasting blood glucose; HDL-C, high-density lipoprotein cholesterol; LDL-C, low-density lipoprotein cholesterol; MetS, metabolic syndrome; TC, total cholesterol; TG, triglyceride; WC, waist circumference.
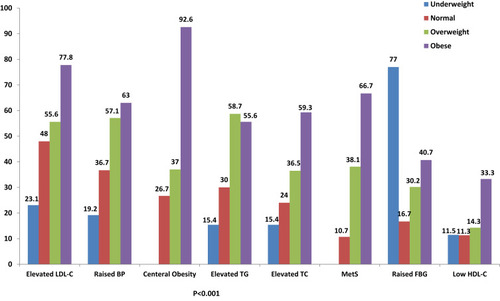
Figure 2 Variation in the mean value of different CVD risk factors with MetS status of the participants (n = 266).
Abbreviations: BMI, body mass index (kg/m2); DBP, diastolic blood pressure (mmHg); FBG, fasting blood glucose (mg/dL); HDL-C, high-density lipoprotein cholesterol (mg/dL); LDL-C, low-density lipoprotein cholesterol (mg/dL); MetS, metabolic syndrome; SBP, systolic blood pressure (mmHg); TC, total cholesterol (mg/dL); TG, triglyceride (mg/dL); WC, waist circumference (cm); W-Ht-R, waist to height ratio; W-Hip-R, waist to hip ratio.
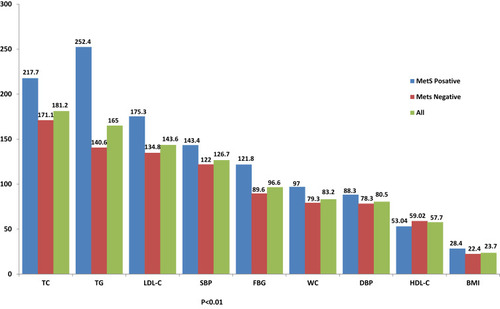
Table 4 Factors Associated with Metabolic Syndrome in Mekelle City (n=266)