Figures & data
Figure 1 The expression of PARP-1 and SIRT-1 in db/db mice and db/m mice. (A and B) Western blotting results showed hyperglycemia decreased the levels of SIRT-1 but increased the activation of PARP-1 and the expression of FN in db/db mice compared to db/m group. (C) Immunofluorescence images showed that the expression of PARP-1 was increased in db/db group mice glomerulus compared with db/m group mice glomerulus, which was contrary to the expression of SIRT-1. Blue, nuclear staining (DAPI); green, target protein staining. Data are presented as mean ± SD. We conduct 3 independent experiments. *Compared with NC, P < 0.05; ***compared with NC, P < 0.001.
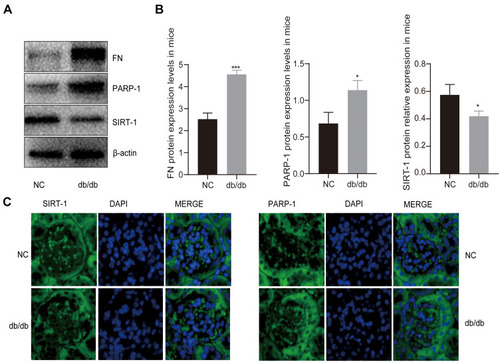
Figure 2 The effect of PARP-1 and SIRT-1 in MCs. (A and B) Proteins expression in MCs in high glucose condition or low glucose condition incubated with different reagents by Western blotting. β-Actin was used as control of protein loading. Bars represent mean ± SD of three independent experiments. *Compared with G5, P < 0.05; ***compared with G5, P < 0.001. #Compared with G25, P < 0.05; ##compared with G25, P < 0.01. (C) Immunofluorescence images showed the change of protein SIRT-1 and PARP-1 expression in different MCs groups. Blue, nuclear staining (DAPI); green, target protein staining. Images were analyzed by confocal microscopy under a 50-μm ruler.
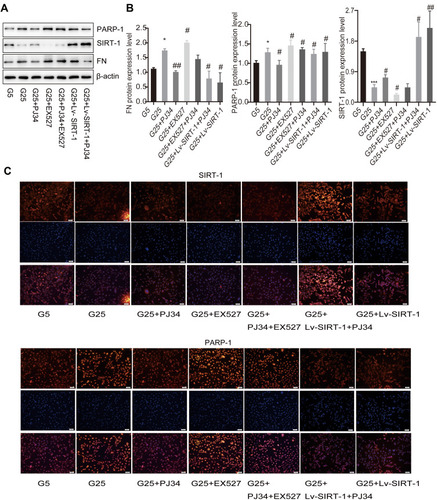
Figure 3 The result of PARP-1 activity and cell viability. (A) PARP-1 activity was measured by PARP-1 activity kit. (B) Cell viability measured by MTT assay upon 48 h treatment of different reagents. Data of three experiments are presented as mean ± SD. *Compared with G5, P < 0.05; **compared with G5, P < 0.01. #Compared with G25, P < 0.05; ##compared with G25, P < 0.01; ###compared with G25, P < 0.001.
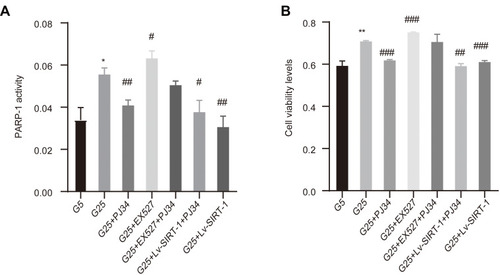
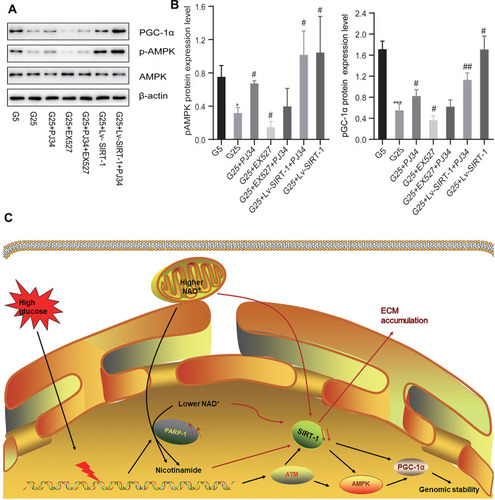
Figure 4 PARP-1 may have a crosslink with SIRT-1 via PGC-1α axis. (A and B) The expression of pAMPK and PGC-1α in MCs in high glucose condition or low glucose condition incubated with different reagents by Western blotting. Data of three experiments are presented as mean ± SD. *Compared with G5, P < 0.05; ***compared with G5, P < 0.001. #Compared with G25, P < 0.05, ##compared with G25, P < 0.01. (C) The possible pathway of the accumulation of ECM in DN patients: PARP-1-NAD+-SIRT-1-PGC-1α axis. High glucose can cause a strong stress to DNA replication, which then be transduced by DNA damage response sensors, such as PARP-1, ataxia telangiectasia mutated (ATM). Then SIRT-1 and AMPK propagate the signal via posttranslational modifications of PGC-1α and other proteins to maintain the integrity of genome. However, the overactivation of PARP-1 can reverse this protectable role, which subsequently contributes to the subcellular difference in NAD+ content between the nucleus and mitochondria and leads to the down-expression of SIRT-1 and finally causes the activation of ECM. The red arrow refers to the pathological phenomenon caused by excessive activation of PARP-1.