
Figures & data
Table 1 Baseline Characteristics in Different Metabolic Obesity Phenotypes
Figure 1 (A) Prevalence of hypotestosteronemia in different metabolic phenotypes of obesity; (B) Prevalence of secondary hypotestosteronemia in different metabolic phenotypes of obesity; (C) Prevalence of primary hypotestosteronemia in different metabolic phenotypes of obesity. Metabolically healthy normal weight (MHNW); metabolically healthy overweight/obese (MHO); metabolically unhealthy normal weight (MUNW), and metabolically unhealthy overweight/obese (MUO). (Graph pad prism8 used to create the artwork.)
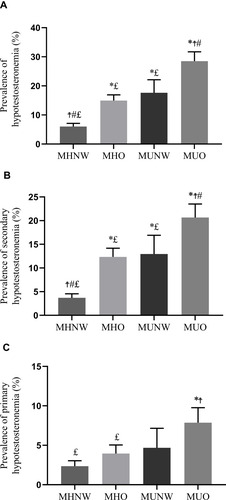
Table 2 Adjusted Correlations of BMI and Presence of the MS with Total Testosterone
Table 3 Logistic Regression Analysis of Hypotestosteronemia According to Different Metabolic Phenotypes of Obesity