Figures & data
Figure 1 Effects of Curcumin on cell viability of NRK-52E cells. Cells were pre-treated with Curcumin (5 μM, 10 μM, 20 μM) for 24 h. Following Curcumin treatment, the medium was changed and cells were treated with 30 mM HG for 48 h. Data are presented as the mean ±SEM (n=6); (**P < 0.001 vs Control group, ##P < 0.001 vs HG).
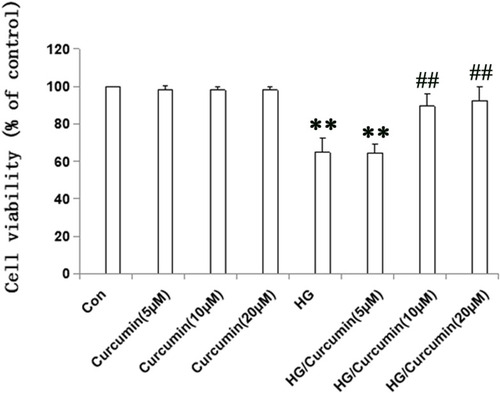
Figure 2 Effects of Curcumin on EMT markers collagen I and E-ca in NRK-52E cells. (A) Effects of Curcumin on morphological changes in NRK-52E cells (a1–a4) and HG treatment in the cells for 48 h led to cell morphological change to a fibroblast-like shape (a3). Protein expression EMT markers, including E-cadherin (red, b1–b4) and collagen I (green, c1–c4), in NRK-52E cells were detected with immunofluorescence chemistry (above, a1-c1. Control group; a2-c2. Curcumin group; a3-c3. HG group; a4-c4.HG plus Curcumin group. Magnification was ×400, Scale bars=30 μm) and Western blot ((B–D), below), and represented in control group; curcumin group; HG group and HG plus Curcumin group, respectively (**P < 0.001 vs Control group, ##P < 0.001 vs HG).
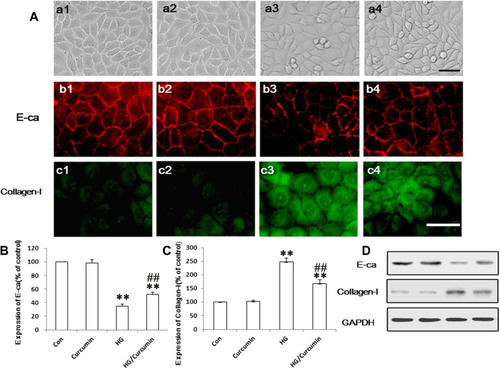
Figure 3 Influence of Curcumin on expression of TLR4 in NRK-52E cells. (A) The NRK-52E cells were pre-treated with Curcumin (20 μM) for 24 h. Following Curcumin treatment, the medium was changed and cells were treated with 30 mM HG for 48 h. The TLR4 protein was stained and observed under a fluorescence microscope as described in Materials and Methods. (A) a. control group; b. Curcumin group; c. HG group; d. HG/Curcumin group (magnification was ×400, Scale bars=30 μm). (B) The protein expression was detected by Western blotting, relative expression levels of TLR4 was, respectively, determined by densitometry and normalized by GAPDH, and data are represented as percentages of the control group. (**P < 0.001 vs Control group, ##P < 0.001 vs HG).
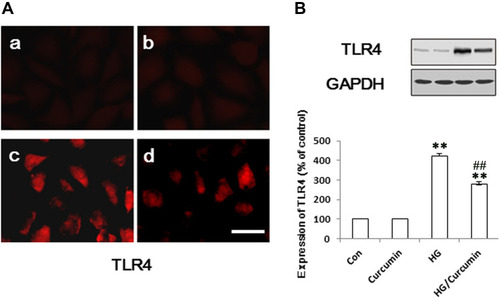
Figure 4 Influence of Curcumin on expression of NF-κB in NRK-52E cells. (A) The NRK-52E cells were pre-treated with Curcumin (20 μM) for 24 h. Following Curcumin treatment, the medium was changed and cells were treated with 30 mM HG for 48 h. The NF-κB protein was stained and observed under a fluorescence microscope as described in Materials and Methods. a. control group; b. Curcumin group; c. HG group; d. HG/Curcumin group (magnification was ×400, Scale bars=30 μm). (B) The protein expression of phospho-NF-κB p65 was detected by Western blotting, relative expression levels of phospho-NF-κB p65 was determined by densitometry and normalized by GAPDH, and data are represented as percentages of the control group. (**P < 0.001 vs Control group, ##P < 0.001 vs HG).
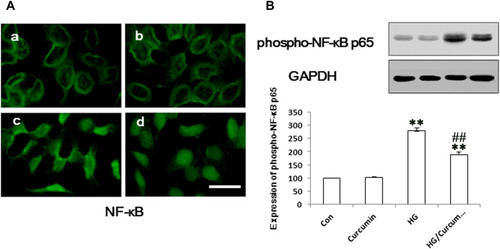
Figure 5 Effect of Curcumin on the ROS production in the HG-treated NRK-52E cells. (A) The HG-induced intracellular ROS levels in NRK-52E cells were measured with DCF-DA staining. a. control group; b. Curcumin group; c. HG group; d. HG/Curcumin group (magnification was ×400, Scale bars=30 μm). (B) Data were expressed as means ± SEM (**P < 0.001 vs Control group, ##P < 0.001 vs HG).
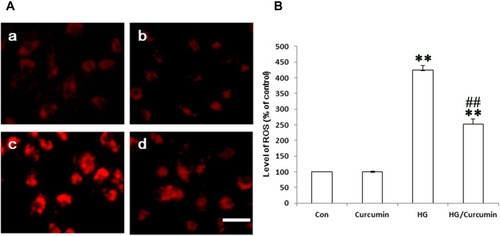
Figure 6 TLR4-NF-κB signaling pathway involves in protective effect of Curcumin on EMT in HG-treated cells. Five μM TAK242 (the inhibitor of TLR4) was added to the medium of NRK-52E cells for 2 h. The cells were subsequently exposed to HG for 48 h after the treatment with Curcumin 20 μM for 24 h. (A). Protein levels of TLR4, expression of phospho-NF-κB p65, and EMT makers were determined by Western blot analysis. (B–E). Each assay was representative of three independent experiments. Data were expressed as means ± SEM (*P < 0.05 and **P < 0.001 vs Control group, ##P < 0.001 vs HG).
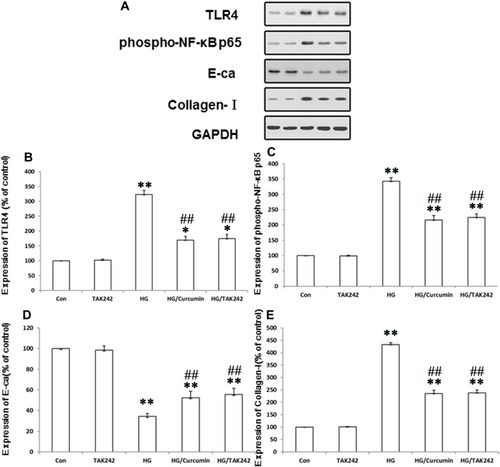
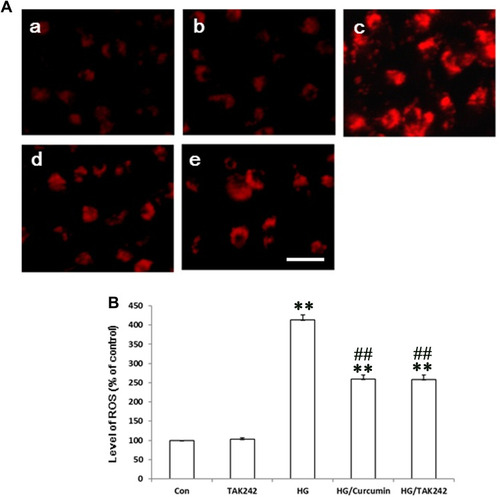
Figure 7 Curcumin via Inhibition of TLR4/NF-κB Signaling reversed the HG-induced ROS Production in NRK-52E Cells. TAK242 5 μM (the inhibitor of TLR4) was added to the medium of NRK-52E cells for 2 h. The cells were subsequently exposed to HG for 48 h after the treatment with Curcumin 20 μM for 24 h. (A) The HG-induced intracellular ROS levels in NRK-52E cells were measured with DCF-DA staining. (a. control group; b. TAK242 5 μM group; c. HG 30 mM group; d. HG/Curcumin group; e. HG/TAK242 group. Magnification was ×400, Scale bars=30 μm). (B) Data were expressed as means ± SEM (**P < 0.001 vs Control group, ##P < 0.001 vs HG).