Figures & data
Figure 1 CL administration reduces the body mass, and improves the serum lipid profile and glucose tolerance, of high-fat diet-fed rats. The body mass (A), serum lipid concentrations (B), glucose tolerance curves (C), and AUCs (D) of C, HF, and HF+CL mice. *p < 0.05 versus C, #p < 0.05 versus HF. Data are mean and SD, n = 8.
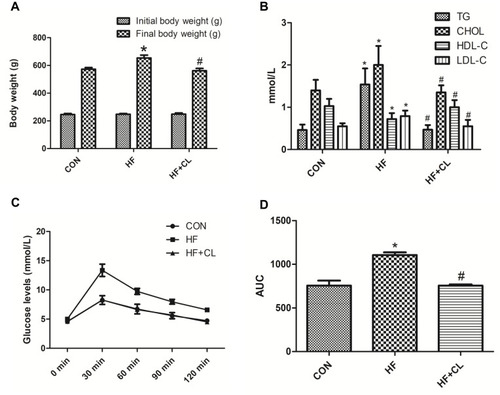
Figure 2 CL administration reduces the peri-epididymal and inguinal adipose tissue depot masses of high-fat diet-fed rats. Representative images of peri-epididymal adipose tissue (A) and inguinal adipose tissue (B) are shown. Magnification 400×. *p < 0.05 versus CON, #p < 0.05 versus HF. Data are mean and SD, n = 8.
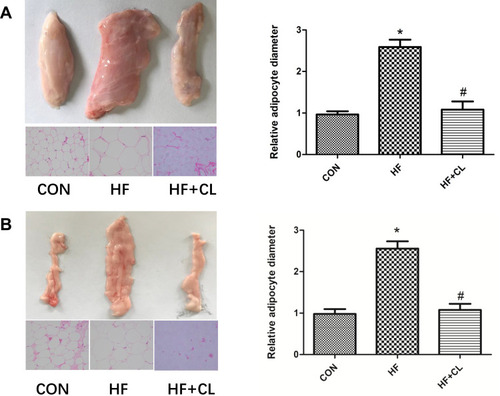
Figure 3 CL administration increases the expression of p-AMPK, PGC-1α, and CPT-1b in the soleus muscles of high-fat diet-fed rats. (A) CL increased the p-AMPK and AMPK protein expression levels in the soleus muscle of HF rats. Bars represent SD, n = 4. (B) CL increased PGC-1α and CPT-1b protein expression levels in the soleus muscle of HF rats, according to Western blot analysis. (C) CL increased PGC-1α and CPT-1b mRNA expression in the soleus muscle of HF rats, according to qPCR. The expression of each target protein/mRNA was normalized to that of GAPDH, then to that of the control samples. *p < 0.01 versus CON, #p < 0.05 versus HF. Data are mean and SD, n = 4–5.
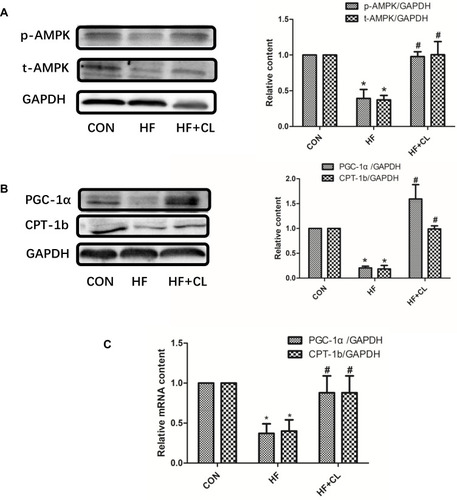
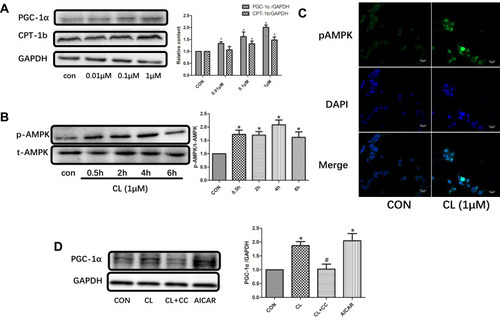
Figure 4 CL increases the expression of AMPK, PGC-1α, and CPT-1b in L6 myotubes. (A) CL treatment for 24 h dose-dependently increased PGC-1α and CPT-1b protein expression in L6 myotubes, according to Western blot analysis. The expression of each target protein was normalized to that of GAPDH, then to that of the control samples. (B) Effects of the treatment of L6 myotubes with CL (1 µM) for the indicated times on the phosphorylation (p-AMPK) and expression of AMPK, according to Western blot analysis. p-AMPK band intensity was normalized to that of total AMPK, then to that of the control samples. (C) Effects of the treatment of L6 myotubes with CL (1 μM) for 4 h on AMPK phosphorylation in immunofluorescence-stained L6 myotubes. Anti-p-AMPK conjugated to FITC and DAPI were used. Magnification 400×. (D) Effects of treatment with CL (1 μM), acadesine (AICAR, a cell-permeable activator of AMPK, 0.5 mM/L), and/or compound C (CC, an inhibitor of AMPK, 10 μM/L) on the expression of PGC-1α. The expression of PGC-1α was normalized to that of GAPDH, then to that of the control samples. *p < 0.01 versus C, #p < 0.01 versus CL. Data are mean and SD, n = 4–6.