
Figures & data
Figure 1 Schematic diagram of the measurement of abdominal fat. (A) Sagittal CT of the chest and abdomen. The marked area indicates abdominal fat (including subcutaneous fat and visceral fat), the yellow area indicates pelvic visceral fat, and the area around the heart is pericardial fat. (B) Coronal CT of the chest and abdomen. The marked area indicates abdominal fat (including subcutaneous fat and visceral fat), the yellow area indicates pelvic visceral fat, and the area around the heart is pericardial fat.
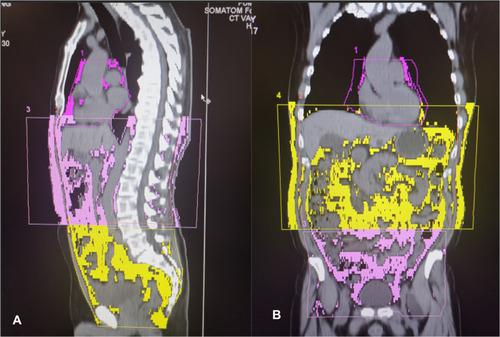
Table 1 The General Characteristics of the Patients
Table 2 Clinical Data of the Patients
Table 3 Fat and Muscle Levels in Middle-Aged and Elderly People of Different Genders
Table 4 The Correlation Between Age and Fat of Different Parts and Psoas Major Muscle
Table 5 The Correlation Between the Pericardial Fat and Abdominal Fat and Psoas Major Muscle