
Figures & data
Figure 1 Example of diabetes optic neuropathy seen on fluorescence fundus angiography (A) and fundus camera (B).
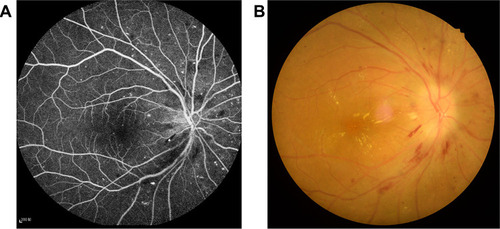
Figure 2 Relationship between magnetic resonance imaging and DON. Diabetes may cause DON. Once DON occurs, it may affect the function of vision and lead to abnormal nerve activity in areas of the brain that are related to visual discrimination.
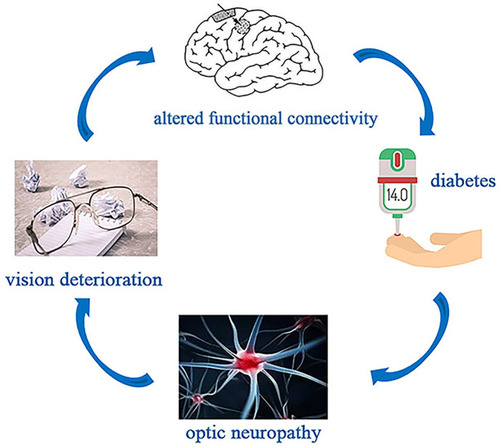
Table 1 VMHC Method Applied in Ophthalmological and Neurogenic Diseases in the Literature
Table 2 Conditions of Participants Included in the Study
Table 3 Brain Areas with Significantly Different VMHC Values Between HCs and DON
Figure 3 Spontaneous brain activity in patients with diabetes optic neuropathy (DONs) versus healthy controls (HCs). (A and B) Significant activity differences were observed in the right temporal inferior area, left temporal inferior area, right cingulum mid area, left cingulum mid area, right supp motor area, and left supp motor area. Red or yellow denote higher voxel mirrored homotopic connectivity(VMHC) values. P<0.01 for multiple comparisons using Gaussian random field theory (z>2.3; P<0.01; cluster >40 voxels, AlphaSim corrected). (C) Mean values of altered VMHC values between the two groups.
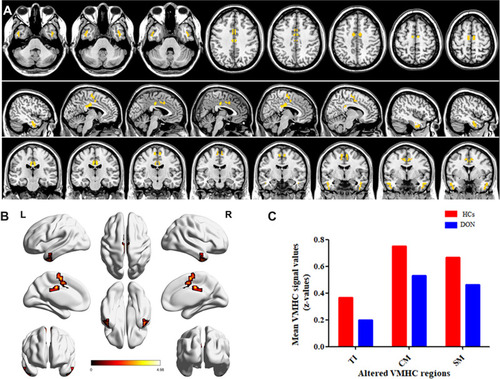
Table 4 Conversion Between the Five-Level Classification Method and Snellen and Log MAR
Figure 4 The VMHC results of brain activity in the DON group. (A)The mean VMHC value of the mid cingulum showed a negative correlation with the left best-corrected VA (r=0.7913, P<0.0001). (B)The best-corrected VA of the right eye negatively correlated with VMHC signal values of the supp motor area (r=0.4080, P=0.0003).
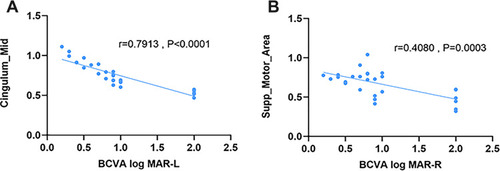
Figure 5 ROC curve analysis of mean VMHC values for altered brain regions.
Abbreviations: ROC, receiver operating characteristic; VMHC, voxel-mirrored homotopic connectivity; RTI, right temporal inferior; LTI, left temporal inferior; RCM, right cingulum mid; LCM, left cingulum mid; RSM, right supp motor; LSM, left supp motor.
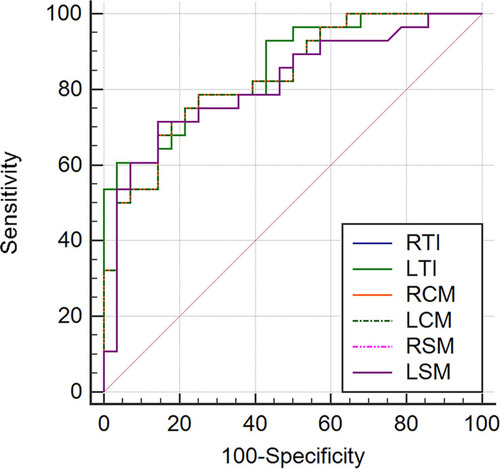
Figure 6 The voxel mirrored homotopic connectivity (VMHC) results of brain activity in the DON group. Compared with the healthy controls (HCs), the VMHC of the following regions in the DON group were decreased to various extents: 1, right cingulum mid area (t=4.9); 2, left cingulum mid area (t=4.9); 3, right supp motor area (t=4.1); 4, left supp motor area (t=4.1); 5, right temporal inferior area (t=4); 6, left temporal inferior area (t=4). The sizes of the spots denote the degree of quantitative changes.
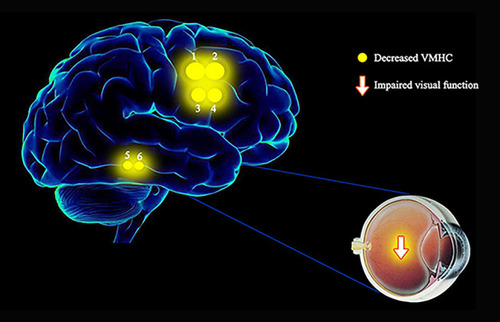
Table 5 Brain Regions Alternation and Its Potential Impact