
Figures & data
Table 1 Main Characteristics of 1608 Cases Undergoing Routine Physical Examination
Figure 1 Patients and study design. 1608 cases were divided into obese group (BMI≧27.5 kg/m2) and non-obese group (BMI < 27.5 kg/m2).Constituent ratio of NAFLD in obese and non-obese population and its relationship with clinical indicators were compared. Risk factors of non-obese NALFD were analyzed.
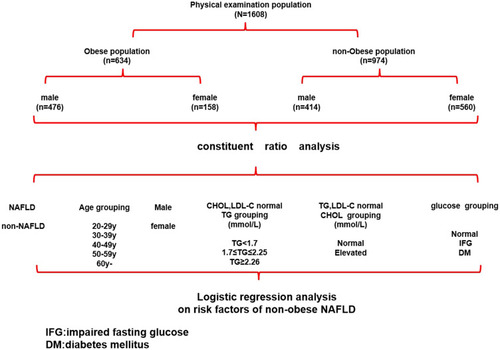
Table 2 Main Characteristics of NAFLD Group and Non-NAFLD Group in Non-Obese Population
Figure 2 Gender distribution of occurrence of NAFLD in non-obese and obese population. Occurrence of NAFLD was higher in obese group than in non-obese group (p<0.001). There was a statistical difference in the occurrence of NAFLD between male and female in non-obese group (p=0.001), no statistical difference was found in obese group (p=0.934).
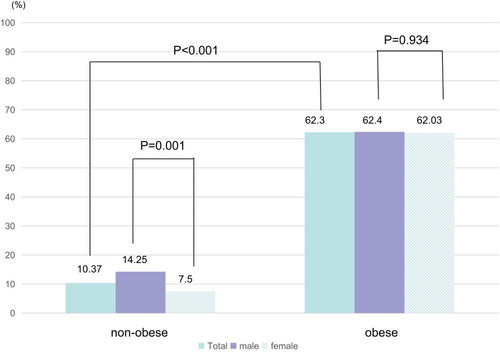
Figure 3 Age distribution of NAFLD in non-obese and obese population.
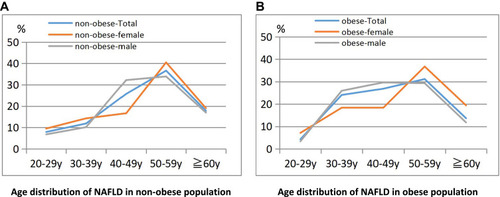
Figure 4 Distribution of TG levels in non-obese and obese population.
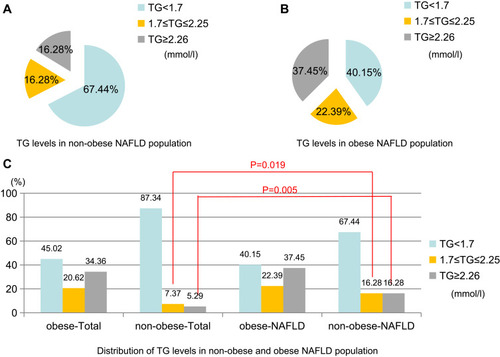
Figure 5 CHOL levels and occurrence of NAFLD in non-obese and obese population. No statistical difference found in the distribution of CHOL levels between obese and non-obese population (p>0.05).
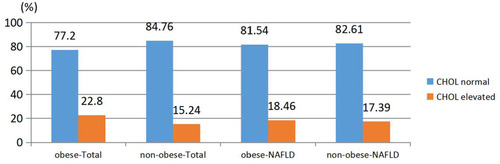
Figure 6 Constituent ratio of different blood glucose levels in non-obese and obese population.
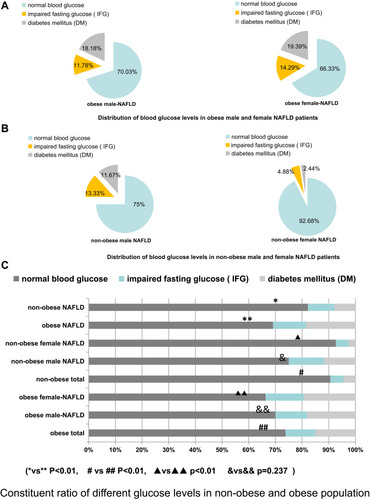
Table 3 Results of Regression Analysis of NAFLD in Non-Obese NAFLD Patients