
Figures & data
Table 1 Clinical and Metabolic Parameters of T2DM Patients
Figure 1 The association between clinical indexes and diabetic nephropathy in the total population. The median of some variables (HbA1c, HOMA-B, HOMA-IR, leptin and resistin) were used as cut-off points when creating groups. The values less than median were as the reference.
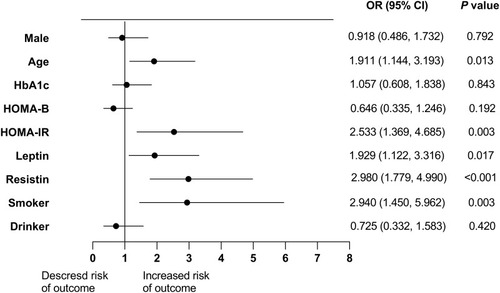
Table 2 Logistic Regression Analysis of Risk Factors for Diabetic Nephropathy in the Normal Weight Group
Figure 2 Receiver operating characteristic (ROC) curves analysis of insulin resistance, leptin, and resistin for diabetic nephropathy in normal-weight, overweight and obese patients with T2DM. ROC curves and corresponding areas under the curve (AUC) for diabetic nephropathy were performed in normal-weight (A), overweight (B) and obese patients (C) with T2DM.
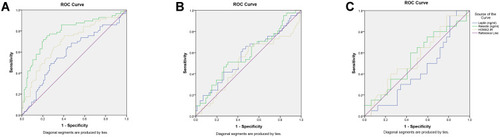
Table 3 Logistic Regression Analysis of Risk Factors for Diabetic Nephropathy in the Overweight Group
Table 4 Logistic Regression Analysis of Risk Factors for Diabetic Nephropathy in the Obesity Group