Figures & data
Figure 1 Co-expression network construction of 22 diabetic nephropathy samples of GSE30528 dataset via WGCNA. (A) The clustering was based on the expression data of differentially expressed genes between tumor samples and normal samples in DN. (B) Relationship between scale-free topology model and soft-thresholds (powers). (C) Relationship between the mean connectivity and various soft-thresholds (powers). (D) Dendrogram of all differentially expressed genes clustered based on a dissimilarity measure (1-TOM). (E) Heatmap of the correlation between module eigengenes and clinical traits. (F) The eigengene adjacency heatmap of the modules.
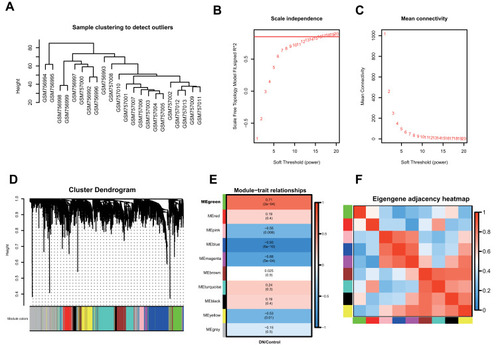
Figure 2 The functional analysis of DEGs in GSE30528 dataset. (A) Heatmap of the DEGs in green module by WGCNA of GSE30528 dataset. (B) The protein-protein interaction network of the DEGs in green module. (C) The top 10 significant KEGG pathways. (D) The pathway map of Complement and coagulation cascades. The red squares represent upregulated genes.
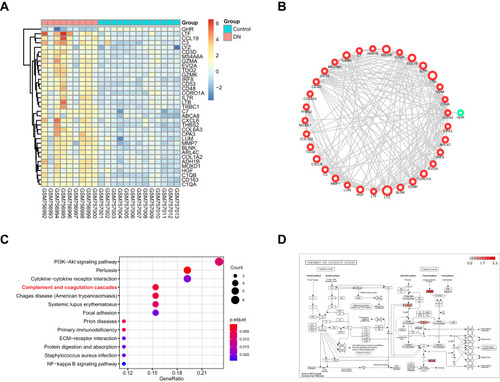
Figure 3 Complement and coagulation cascades was significantly activated in DN. (A) The top 10 significant KEGG pathways in GSE96804 dataset. (B) GSEA analysis of GSE96804 dataset. (C) The pathway map of Complement and coagulation cascades. The red squares represent upregulated genes. (D) The Venn map of common DEGs between GSE30528 green module and GSE96804 dataset.
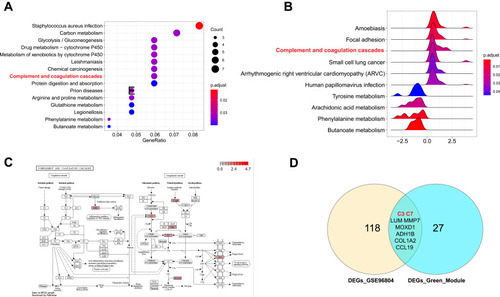
Figure 4 RT-qPCR analysis of C7 and C3. (A) Validation the expression level of C7 (**p< 0.01). (B) Validation the expression level of C3 (p>0.05). (C) The receiver operating characteristic curve of C7 in distinguishing DN.
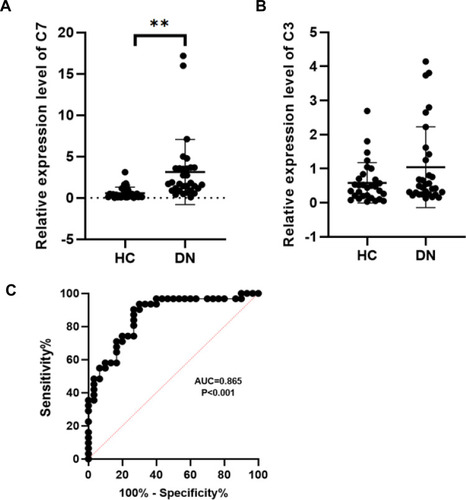
Figure 5 The scRNA-seq analysis validation of C7. (A) The expression of common DEGs between GSE30528 and GSE96804 datasets in different types of cell groups in DN were predicted. PCT, proximal convoluted tubule; CFH, complement factor H; LOH, loop of Henle; DCT, distal convoluted tubule; CT, connecting tubule; CD, collecting duct; PC, principal cell; IC, intercalated cell; PODO, podocyte; ENDO, endothelium; MES, mesangial cell; LEUK, leukocyte. The yellow diamond represents the cell type, red represents up-regulation, blue represents down-regulation, and the circle size is based on Degree. (B) DN and control samples were integrated into a single dataset. (C) The distribution of C7 in different cells between healthy controls and DN. (D) The relative expression level of C7 in identified cell types between healthy controls and DN. (E) The percent expression of C7 in identified cell types between healthy controls and DN.
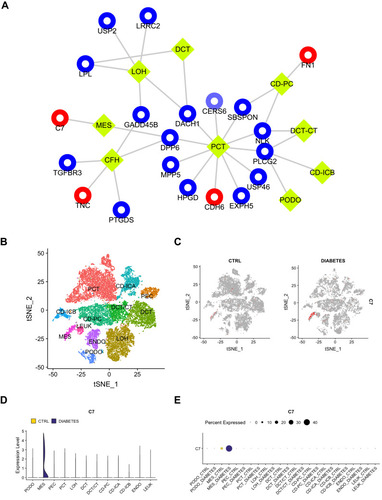
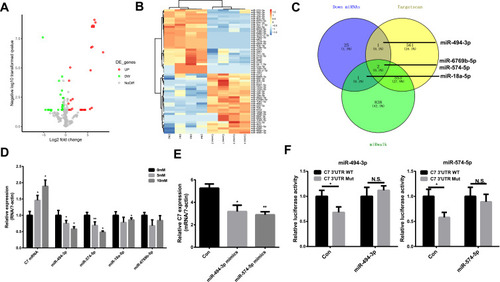
Figure 6 MiR-494-3p and miR-574-5p are regulators of C7. (A) and (B) The heatmap and volcano plot of differentially expressed miRNAs. (C) The common miRNAs compared with miRNAs predicted by Targetscan and miRwalk. (D) The relative expression of C7 and different miRNAs in MES cell treated with different glucose. (E) The relative C7 expression in DN cell treated with miR-494-3p mimics and miR-574-5p mimics. (F) Detection of the binding of miR-494-3p and miR-574-5p with C7 by luciferase reporter gene assay. *p < 0.05, **p< 0.001.