Figures & data
Table 1 Sequences of Primers Used in qRT-PCR
Table 2 Main Components of Qihu
Figure 1 The results of the HPLC-ESI-Q-TOF analysis of Qihu. The results of the HPLC-ESI-Q-TOF analysis of Qihu. (A) The main components chemical structures of Qihu were 1. Quercetin, 2. Ferulic acid, 3. Dendrobine, 4. Sophoradiol, 5. Gigantol, 6. Naringin, 7. Notoginsenoside R1, and 8. Ginsenoside Rb1. (B) All of these compounds are the main ingredients of Panax notoginseng, Dendrobium nobile, Astragalus membranaceus and Pueraria lobata, etc.
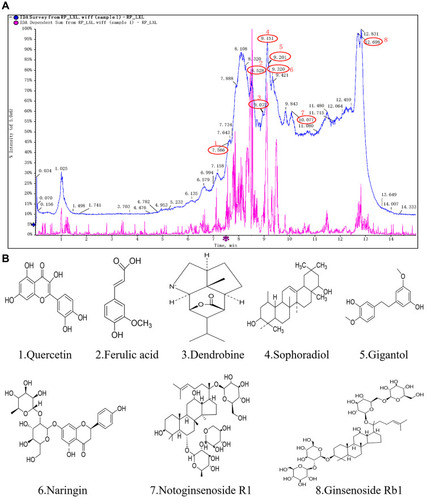
Figure 2 The effects of Met and Qihu on food intake and body weight in db/db mice. The db/db mice were treated with 0.3% sodium carboxymethyl cellulose (CMC-Na, used as DM control), Met or different doses of Qihu as described in methods. BKS mice were used as the negative control group, which was intragastrically administered with 0.3% CMC-Na. (A) The food intake was measured for 3 consecutive days every week for 4 weeks, and then the average food intake per animal was calculated. (B) The body weight was monitored once a week. All data were expressed as mean ± SD (n = 7–8). ## p < 0.01 vs NC, *p < 0.05 or **p < 0.01 vs DM.
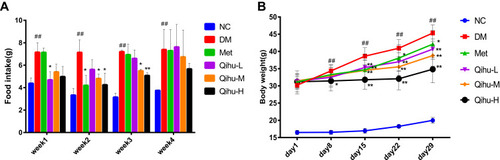
Figure 3 The effects of Met and Qihu on the levels of blood glucose and TG in db/db mice. (A) The effects of Met and Qihu on the levels of blood glucose in db/db mice. The blood glucose levels were monitored once a week. (B) The effect of Met and Qihu on glucose tolerance in db/db mice. (C) The effect of Met and Qihu on TG levels in db/db mice. All data were expressed as mean ± SD (n = 7–8). # p < 0.05 or ## p < 0.01 vs NC, *p < 0.05 or **p < 0.01 vs DM.
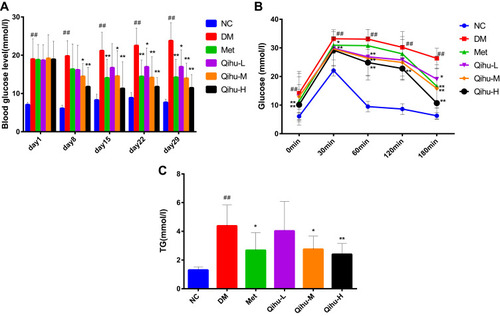
Table 3 Pathological Scoring Criteria of Liver
Figure 4 The effect of Met and Qihu on the pathological changes of liver in db/db mice. (A) The effect of Met and Qihu on the pathological changes of liver in db/db mice. The liver was excised from db/db mice and part of the tissues was fixed with 4% paraformaldehyde, and then embedded in paraffin and stained with hematoxylin and eosin (magnification: ×400). (B) The result of pathological score in all the groups of mice. All data were expressed as mean ± SD (n = 7–8). ## p < 0.01 vs NC, *p < 0.05 or **p < 0.01 vs DM.
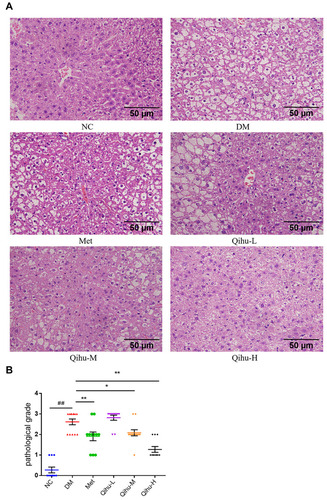
Figure 5 The effect of Qihu on the expression levels of IL-1β and IL-6 in the liver and pancreas of db/db mice. (A–D) The IL-1β and IL-6 mRNA levels in liver (A and B) and pancreas (C and D) were detected using qRT-PCR assay. (E and F) The IL-1β and IL-6 protein levels in the liver (E and F) and pancreas (G and H) were detected using ELISA analysis. All data were expressed as mean ± SD (n = 3). ## p < 0.01 vs NC, *p < 0.05 or **p < 0.01 vs DM.
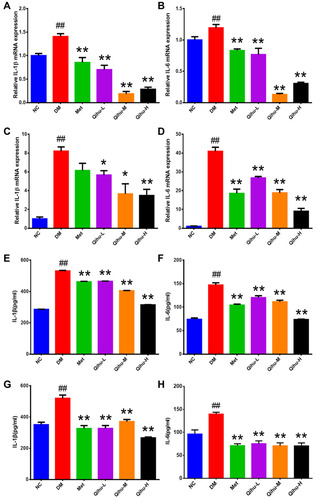
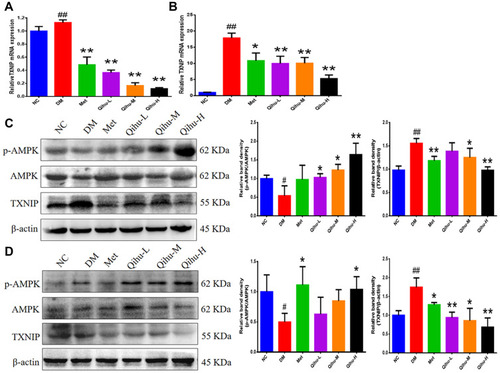
Figure 6 The effect of Qihu on AMPK signaling and TXNIP expression in the liver and pancreas of db/db mice. (A and B) The TXNIP mRNA levels in the liver (A) and pancreas (B) were detected by qRT-PCR assay. All data were expressed as mean ± SD (n = 3). (C and D) The protein levels of p-AMPK, AMPK and TXNIP in the liver (C) and pancreas (D) were detected by Western blot assay. The left panel is the representative Western blot result, and the right panel is the quantitative result of Western blot. # p < 0.05 or ## p < 0.01 vs NC, *p < 0.05 or **p < 0.01 vs DM.