Figures & data
Figure 1 Flowchart of the study population. Type-2 diabetes mellitus (T2DM) was diagnosed based on the diagnostic criteria for T2DM set by the World Health Organization in 1999. Data used in this analysis were collected for all participants by the same instruments and methods.
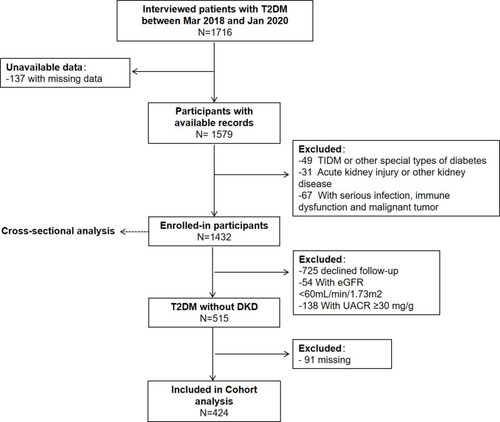
Table 1 Binary Logistic Regression for UACR, eGFR and DKD According to the Quartiles of the TyG Index in Cross-Sectional Data
Figure 2 Cox regression for DKD according to the tertiles of the TyG Index in longitudinal data. Model 1 was adjusted for age and sex. Model 2 was adjusted for the duration of diabetes mellitus, history of hypertension, and BMI in addition to the variables in model 1. Model 3 was adjusted for hypoglycemic therapy, hypolipidemic therapy, and anti-hypertension drugs in addition to the variables in model 2.
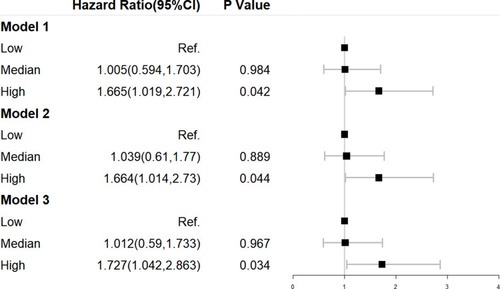
Table 2 Characteristics of Participants
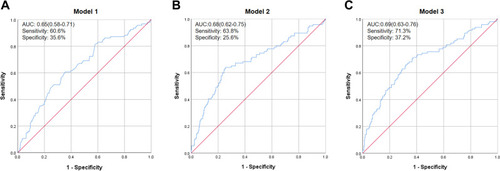
Figure 3 Receiver–operator characteristic (ROC) curves of the TyG Index adjusted for different variables to predict DKD in longitudinal data. ROC curves of the TyG Index adjusted for different variables to predict DKD in longitudinal data. (A) Model 1 was adjusted for age and sex. (B) Model 2 was adjusted for the duration of diabetes mellitus, history of hypertension, and BMI in addition to the variables in model 1. (C) Model 3 was adjusted for hypoglycemic therapy, hypolipidemic therapy, and anti-hypertension drugs in addition to the variables in model 2.