
Figures & data
Figure 1 Representative fluorescein angiograms with FAZ outlines: (A) grade ≤2; (B) grade ≥3 according to the ETDRS report number 11.Citation15 The same angiograms with FAZ area boundaries and sizes: (C and D).
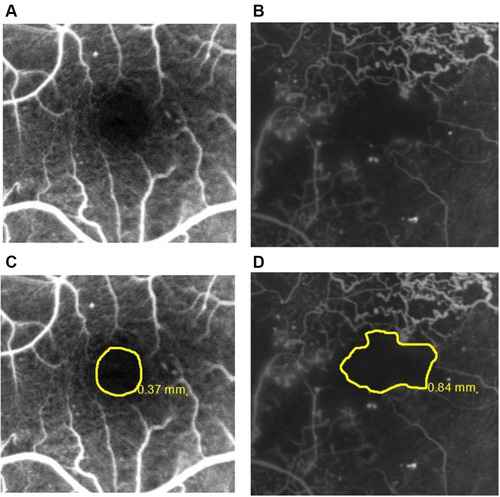
Figure 2 Representative OCT scan across the fovea. ILM and BM were detected automatically, while the choroidal-scleral junction was marked manually. SFCT was defined as the distance between the BM and the choroidal-scleral junction at the fovea (blue arrow b). The SFCT was obtained as a difference between the total thickness (retinal + choroidal thickness, from the ILM to the choroidal-scleral junction) (yellow arrow c) and the central foveal thickness (red arrow a). Analogically, the choroidal thickness outside the fovea (blue arrow e) was calculated by subtracting the retinal thickness (red arrow d) from the total thickness (retinal + choroidal thickness, from the ILM to the choroidal-scleral junction) (yellow arrow f).
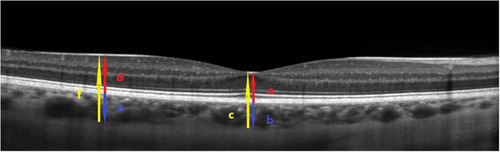
Table 1 Baseline Characteristics of Patients with Diabetic Retinopathy
Table 2 Choroidal Parameters in Patients with Diabetic Retinopathy
Table 3 Univariate Models to Analyze Relationships Between Choroidal Parameters and FAZ Outline in Patients with Diabetic Retinopathy
Table 4 Correlations Between FAZ Area and Choroidal Parameters in Patients with Diabetic Retinopathy Overall and in Patients with CSME and Without
Table 5 Univariate Mixed-Effect Models to Compare Choroidal Parameters in Patients with Diabetic Retinopathy and FAZ Area >0.355 and <0.355mm2