
Figures & data
Figure 1 Flowchart of study participants.
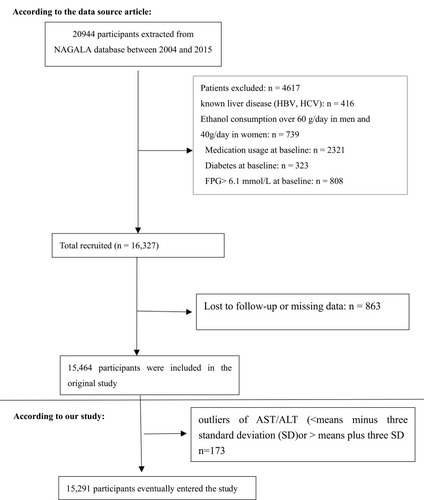
Table 1 The Baseline Characteristics of Participants
Table 2 Univariate Analysis Between Variables and Incidence of T2DM
Figure 2 Kaplan–Meier event-free survival curve based on AST/ALT ratio quartiles and the incidence of T2DM.
Notes: Kaplan–Meier event-free survival curve. Kaplan–Meier analysis of diabetes incident based on AST/ALT quartiles (log-rank, P < 0.0001).
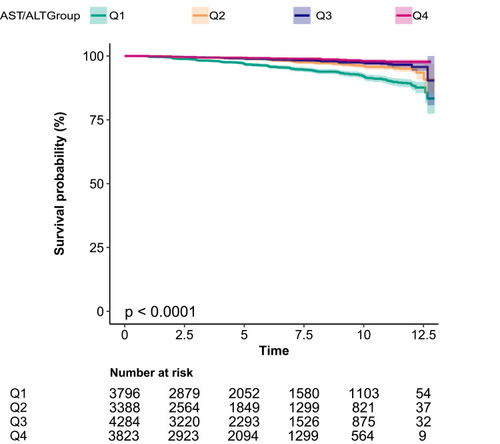
Table 3 Association Between AST/ALT Ratio and the Incidence of T2DM in Different Models
Table 4 The Result of the Two-Piecewise Linear Regression Model
Figure 3 The non-linear relationship between AST/ALT and the incidence of diabetes.
Notes: The non-linear relationship between AST/ALT and the incidence of diabetes. A non-linear relationship between them was detected after adjusting for sex, age, WC, BMI, exercise, ethanol consumption, smoking status, SBP, DBP, TC, HDL, TG, FPG.
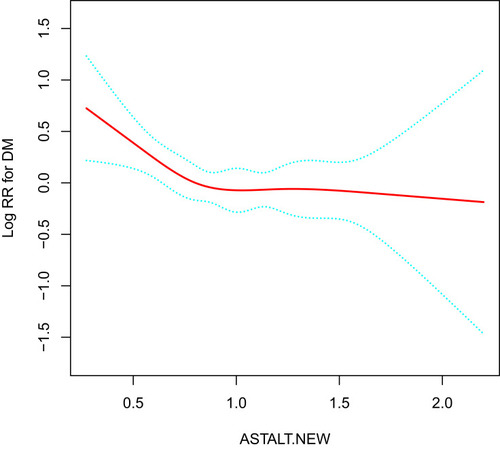
Table 5 Effect Size of AST/ALT on Diabetes in Prespecified and Exploratory Subgroups