Figures & data
Table 1 Polymerase Chain Reaction Primer Sequences
Figure 1 Exosomes isolation and characterization. (A) Western blot analysis of Alix and TSG101, Whole cell lysates (WCL) of MIN6 cells were loaded as controls. (B) Representative TEM image. Arrowheads indicate exosomes. Scale bar =200 nm. (C) Size distribution detection by NTA.
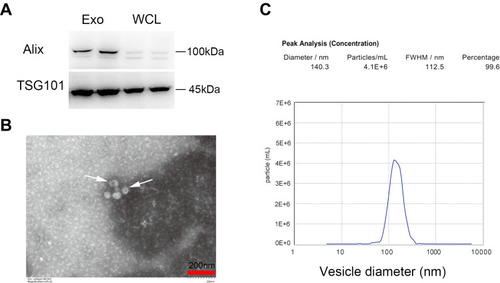
Figure 2 MIN6-derived exosomes integrated and delivered cargoes to iPSCs. (A) Exosomes labeled with PKH67 were visible in iPSCs 24 h after incubation, scale bar = 50 μm. (B) Diagram for transwell assay. (C) Red fluorescence from Cy3-labeled siRNA in MIN6 cells in the top well (a–c) and in iPSCs in the bottom well (d–f), scale bar = 100 μm. Hoechst was applied for nuclei staining.
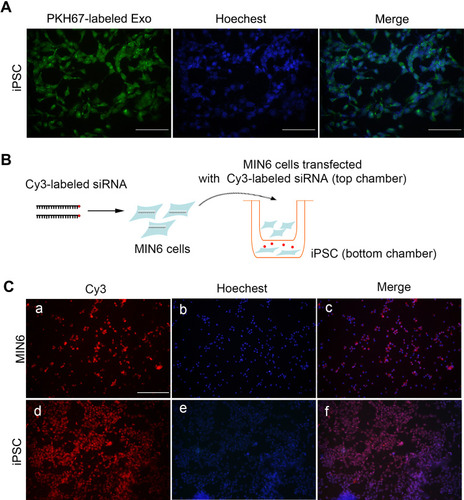
Figure 3 Insulin+ cells, iPSCs morphology, and gene expression at an early stage. (A) Schematic diagram showing the experimental timeline. (B) Flow cytometry detection on day 7. (C) Bright-field images of iPSCs morphology, red arrows indicate the cell clusters, scale bar = 100 μm. (D) Expression of selected endocrine and beta cell specific genes in iPSCs. GAPDH was used as the internal control. Error bars show mean ± SD (n = 3). Compared with day 3,*p < 0.05, **p < 0.01, ***p < 0.001, ****p < 0.001; Compared with the control group on the same day, #p < 0.05, ##p < 0.01, ###p < 0.001.
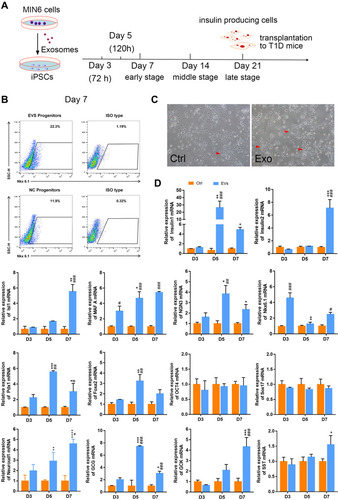
Figure 4 Immunofluorescence assays for Nkx6.1 and insulin expression. Representative images of co-immunostaining of Nkx6.1 (green) and insulin (red), nuclear Hoechst staining is shown in blue, scale bar = 50μm.
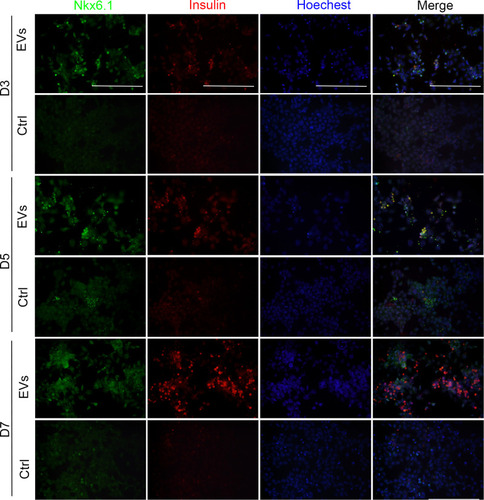
Figure 5 Insulin+ cells and gene expression at the middle and late stage. (A) FCM detection on day 14. (B) qRT-PCR for Ago2 knockdown efficiency. (C) Western blotting for Ago2 knockdown efficiency. (D) Expression of selected endocrine and beta cell specific genes. GAPDH was used as the internal control. Error bars show mean ± standard deviation (SD) (n = 3). Compared with day 14,*p < 0.05, **p < 0.01, ***p < 0.001, ****p < 0.001; Compared with the control group on the same day, #p < 0.05, ##p < 0.01, ###p < 0.001, ####p < 0.0001.
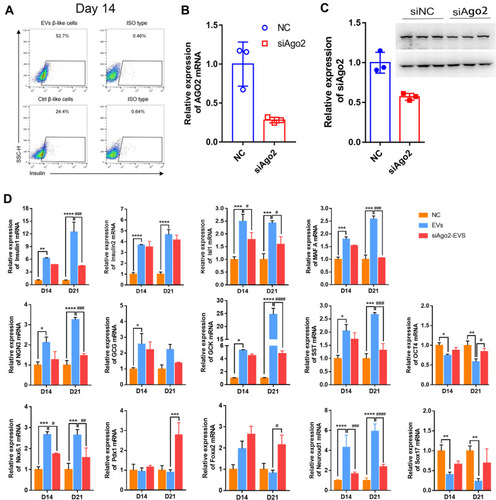
Figure 6 Immunofluorescence assays for glucagon and insulin expression at the late stage. Representative images of co-immunostaining of glucagon (green) and insulin (red), nuclear Hoechst staining is shown in blue. iPSCs cultured with knockout DMEM (A–D), iPSCs cultured with differentiation medium containing exosomes (E–H), iPSCs cultured with differentiation medium containing si-Ago2 exosomes (I–L). Scale bar = 50 μm.
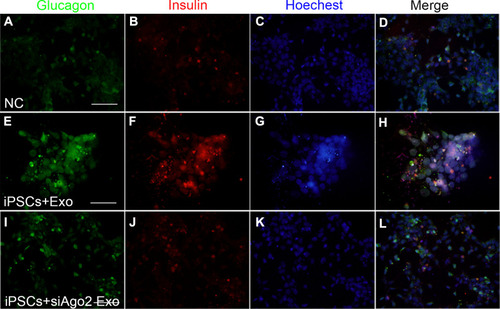
Table 2 List of miRNAs Detected During Differentiation Stages in the Experiment
Figure 7 Common expressed miRNAs screening in cells and exosomes and single-assay validation. (A) Venn diagram presented exosomal miRNAs sequenced from two database. Seven highly expressed exosomal miRNAs among the 24 miRNAs were validated. Cells shaded in red or blue highlighted indicated the miRNAs reported associated with stem cell differentiation. (B) Confirmation of seven selected miRNAs by qPCR in MIN6 cells, MIN6 exosomes, siAgo2-MIN6 cells, siAgo2-MIN6 exosomes. (C) Single-assay validation of miRNAs in iPSCs. Error bars show mean ±SD (n = 3). Compared with day 7, *p < 0.05, **p < 0.01, ***p < 0.001, ****p < 0.0001; Compared with NC group on the same day, ##p < 0.01, ###p < 0.001, ####p < 0.0001.
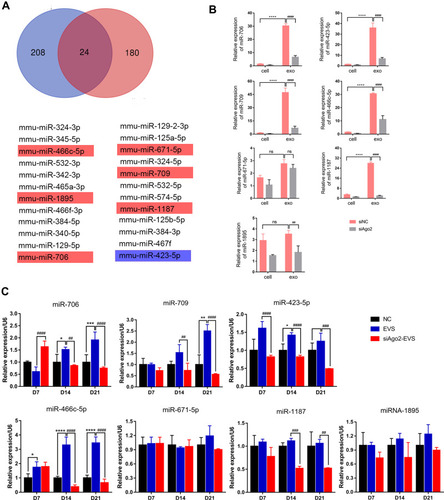
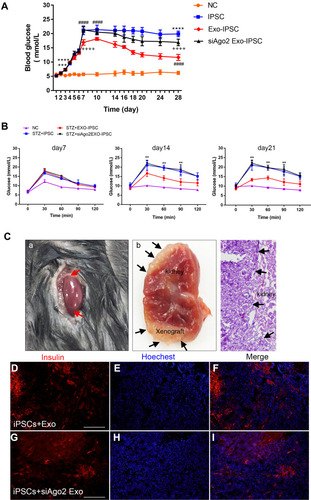
Figure 8 Transplantation of IPCs into STZ pre-treated C57BL/6J mice. (A) Non-fasting blood glucose concentrations of STZ +iPSCs, STZ+exo-iPSCs and STZ+siAgo2exo-iPSCs group (n = 8); NC group, n = 5. Data were showed as mean ± SD, STZ+ iPSCs group compared with NC group, ***P < 0.001, ****p < 0.0001; STZ+exo-iPSCs group compared with STZ+iPSCs group, ####p < 0.0001; STZ+ siAgo2exo-iPSCs group compared with STZ+ exo-iPSCs group, ++++p < 0.0001. (B) IPGTT were performed on day 7, day 14 and day 21. Data were showed as mean ± SD, STZ+ exo-iPSCs group compared with STZ+iPSCs group, **P < 0.01. (C) HE staining and immunofluorescence detection for insulin (red) at day 28 after transplantation. Red arrows point to the renal graft transplanting site (A). Black arrows point to the gross images of two grafts within the renal capsule (B) and the demarcation between the graft and the host kidney tissue (C). Immunofluorescence images for STZ+exo-iPSCs group (D–F) and STZ+siAgo2exo-iPSCs group (G–I). Scale bar =50 μm.