
Figures & data
Figure 1 Flow chart of participants and enrollment time in Guangzhou Nutrition and Health Study.
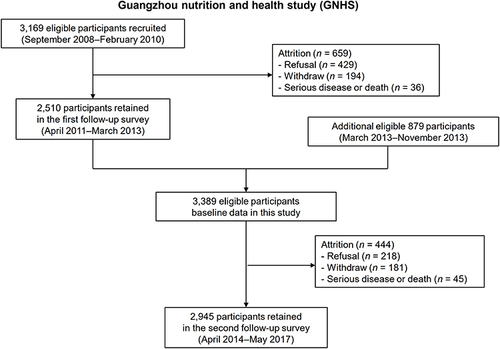
Figure 2 Specific grouping characteristics of the participants in this study.
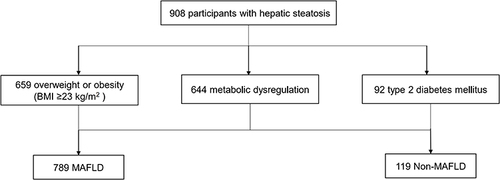
Table 1 Clinical Characteristics of Subjects in Non-MAFLD and MAFLD Groups
Figure 3 (A) Comparison of the non-MAFLD group and MAFLD groups diagnosed by different criteria. (B) Distribution of adipsin quartile levels between the MAFLD and non-MAFLD groups. ***P < 0.001.
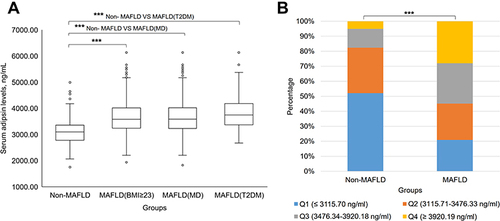
Table 2 Association Between Serum Adipsin Levels and MAFLD
Figure 4 Serum adipsin levels in MAFLD patients with or without metabolic dysregulation. **P < 0.01.
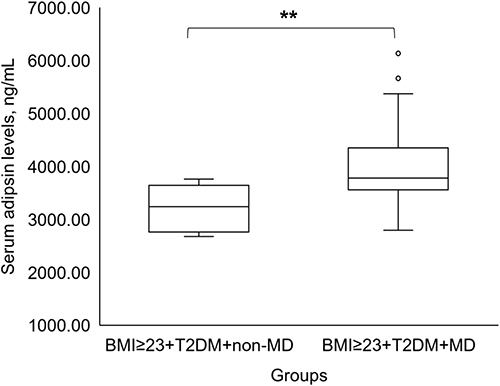
Figure 5 (A) Relationship between the number of metabolic risk abnormalities and serum adipsin levels. The trend test was conducted by Jonckheere-Terpstra. (B) Relationship between the number of metabolic risk abnormalities and the severity of MAFLD. The trend test was conducted by linear-by-linear association chi square test.
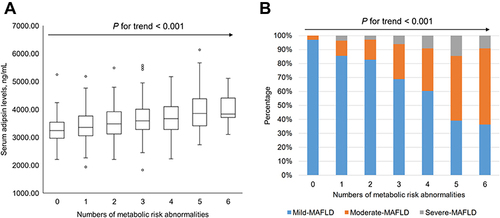
Figure 6 Differences in serum adipsin levels among MAFLD with different severity. The trend test was conducted by Jonckheere-Terpstra.
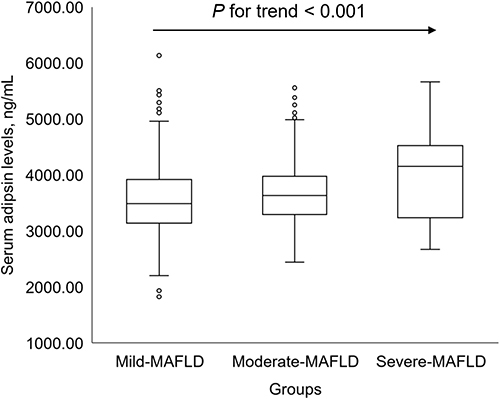
Table 3 Spearman Correlation of Adipsin with Some Factors in MAFLD and Non-MAFLD Groups
Table 4 Subgroup Analysis of Clinical Characteristics of Patients with MAFLD Based on Severity of Fatty Liver