
Figures & data
Table 1 Comparison of Basic Characteristics of Participants in the Three Study Groups
Figure 1 Relationship between fasting FFA, TG, and fasting LgFGF21. (A) Correlation between fasting FFA and LgFGF21. (B) Correlation between fasting TG and LgFGF21.
Abbreviations: FFA, free fatty acid; FGF21, fibroblast growth factor 21; TG, triglyceride.
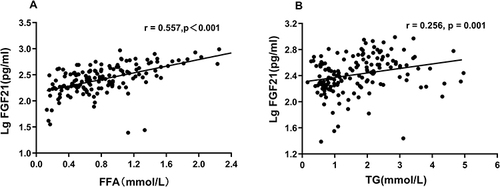
Table 2 Comparison of Lipids Concentrations During the OFTT in the Three Groups
Figure 2 Changes in FFA and FGF21 levels after a high-fat diet in the three groups. (A) FFA. (B) FGF21.
Notes: FFA concentrations are shown as means; FGF21 levels are shown as medians, and statistical analysis was performed using logarithmic transformation. #P < 0.05 versus NFT group, ##P < 0.001 versus NFT group, &P < 0.05 versus IFT group, &&P < 0.001 versus IFT group, *P < 0.05 versus 0 h in the same group, and **P < 0.001 versus 0 h in the same group.
Abbreviations: NFT, normal fat tolerance group; IFT, impaired fat tolerance group; HTG, hypertriglyceridemia group. FFA, free fatty acid; FGF21, fibroblast growth factor 21.
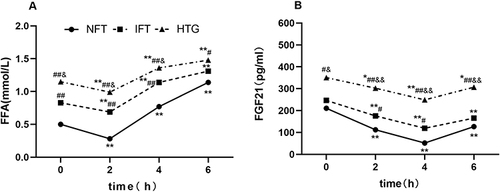
Figure 3 Changes in other lipid levels after a high-fat diet in the three groups. (A) TG. (B) TC. (C) HDL-C. (D) LDL-C.
Notes: #P < 0.05 versus NFT group, ##P < 0.001 versus NFT group, &P < 0.05 versus IFT group, &&P < 0.001 versus IFT group, *P < 0.05 versus 0 h in the same group, and **P < 0.001 versus 0 h in the same group.
Abbreviations: NFT, normal fat tolerance group; IFT, impaired fat tolerance group; HTG, hypertriglyceridemia group.
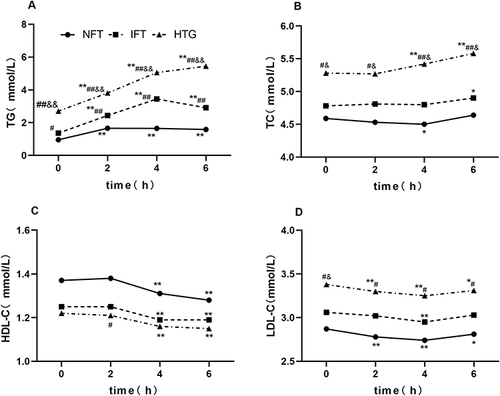
Table 3 Multiple Linear Regression Analysis of FGF21 iAUC