Figures & data
Figure 1 Flowchart of participants excluded and included in this study.
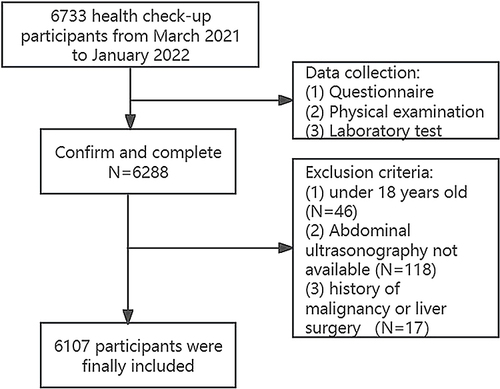
Table 1 Baseline Characteristics of the Study Population According to Sex (n=6107)
Table 2 Baseline Characteristics of the Study Population by CMI Quartiles According to Sex (n=6107)
Figure 2 Prevalence of MAFLD according to CMI quartile by sex.
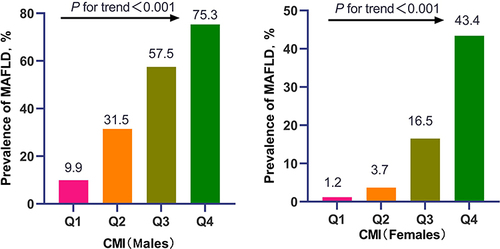
Figure 3 The heatmap of the correlation between baseline variables and CMI using the Pearson’s correlation analysis among by sex. *P<0.05;**P<0.01;***P<0.001.
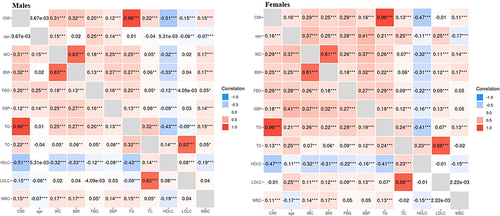
Figure 4 Restricted cubic spline of the association between CMI and MAFLD risk by sex. The association was adjusted for age, smoking, drinking, WC, BMI, WHtR, diabetes, hypertension, dyslipidemia, AST, ALT, WBC, NE and LY. The medians CMI of males (0.9) and females (0.4) were chosen as a reference. The plot showed an increased risk of MAFLD with the elevated CMI, which were above the medians of CMI.
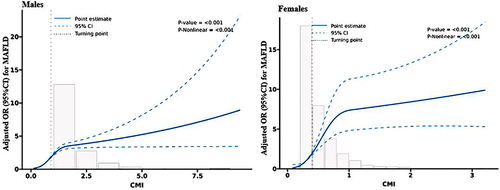
Table 3 Adjusted Associations Between CMI Quartiles and MAFLD Risk by Gender
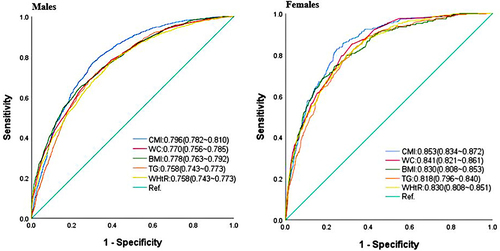
Table 4 AUCs of Various Indexes for Discriminating MAFLD by Sex
Figure 5 ROC curve comparison of obesity-related indices and TG in predicting MAFLD by sex.