Figures & data
Figure 1 Flow chart for selecting patients with DFUs.
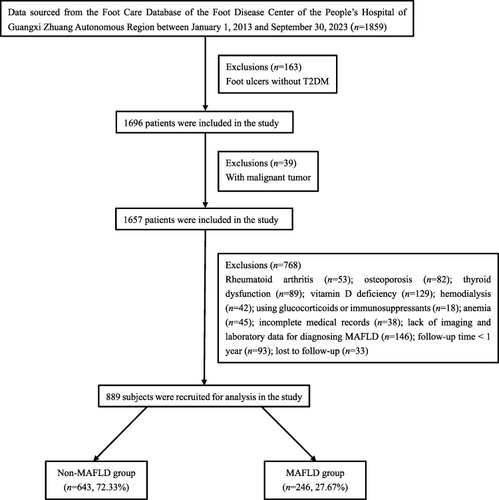
Table 1 Baseline Characteristics of the Subjects
Table 2 Risk of MACCEs in Subjects with DFUs Between Two Groups Through Multivariate Cox Regression Analyses
Figure 2 The incidence of MACCEs in patients with DFUs between MAFLD and non-MAFLD groups.
Notes: During the follow-up period with a median of 63 months for 10.9 years, the incidence rate of MACCEs, including non-fatal myocardial infarction, coronary artery revascularization, heart failure, non-fatal stroke, and all-cause mortality, was listed in detail between the MAFLD and non-MAFLD groups.
Abbreviations: MACCEs, major adverse cardiac and cerebral events; MAFLD, metabolic dysfunction-associated fatty liver disease.
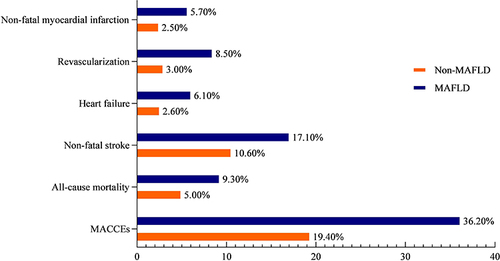
Figure 3 Subgroup stratified analysis for the association between MAFLD and MACCEs in the forest plots.
Notes: Except for the stratification factors themselves, each stratification was adjusted for all factors, including all independent variables in the Cox regression analysis. *P < 0.05.
Abbreviations: MAFLD, metabolic dysfunction-associated fatty liver disease; MACCEs, major adverse cardiac and cerebral events; HR, hazard ratio; CI, confidence interval; LDL-C, low-density lipoprotein cholesterol; SBP, systolic blood pressure; CHD, coronary heart disease; PAD, peripheral arterial disease; DN, diabetic nephropathy.
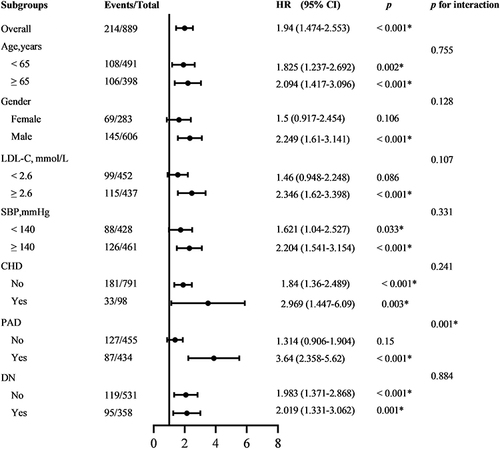
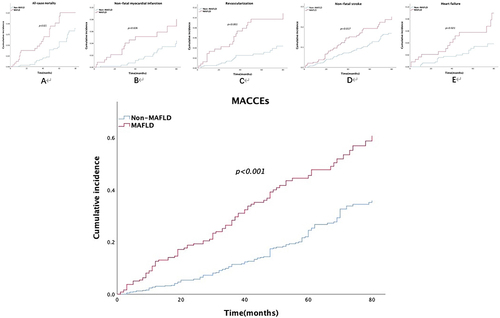
Figure 4 The cumulative incidence of MACCEs between MAFLD and non-MAFLD groups.
Notes: Kaplan‒Meier analysis showed that compared with the non-MAFLD group, the MAFLD group had a higher cumulative incidence of MACCEs consisting of all-cause mortality (A), non-fatal myocardial infarction (B), coronary artery revascularization (C), and non-fatal stroke (D), and heart failure (E) in patients with DFUs (log-rank, p < 0.05).
Abbreviations: MACCEs, major adverse cardiac and cerebral events; MAFLD, metabolic dysfunction-associated fatty liver disease.