Figures & data
Table 1 Clinical Characteristics of Included Patients
Figure 1 Flow chart of case screening.
Abbreviations: T2DM, type 2 diabetes mellitus; DR, diabetic retinopathy; NDR, non-diabetic retinopathy.
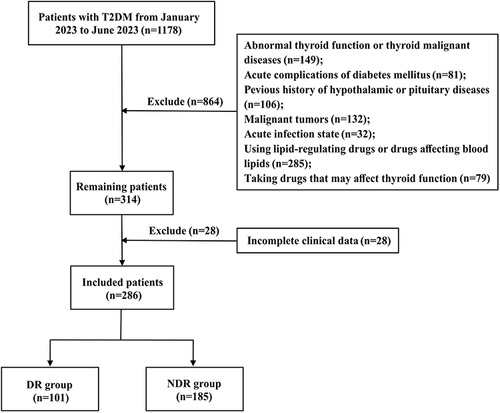
Table 2 Comparison of Thyroid-Related Hormones, Blood Sugar and Blood Lipid Levels
Table 3 Logistics Regression Analysis for the Risk Factors of Diabetic Retinopathy
Figure 2 Comparison of FBG, HbA1c or TG at different TSH levels in diabetic retinopathy patients. *P < 0.05, **P < 0.01.
Abbreviations: TG, triglycerides; FBG, fasting blood glucose; HbA1c, glycated hemoglobin; TSH, thyroid stimulating hormone.
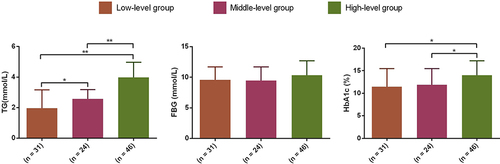
Figure 3 Comparison of FBG, HbA1c or TG at different FT3 levels in diabetic retinopathy patients. *P < 0.05, **P < 0.01.
Abbreviations: TG, triglycerides; FBG, fasting blood glucose; HbA1c, glycated hemoglobin; FT3, free triiodothyronine.
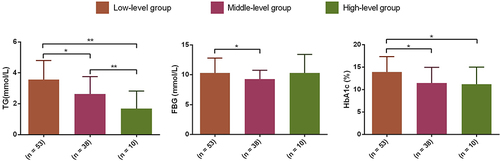
Table 4 Multivariate Linear Regression Analysis of TSH and FT3 Levels
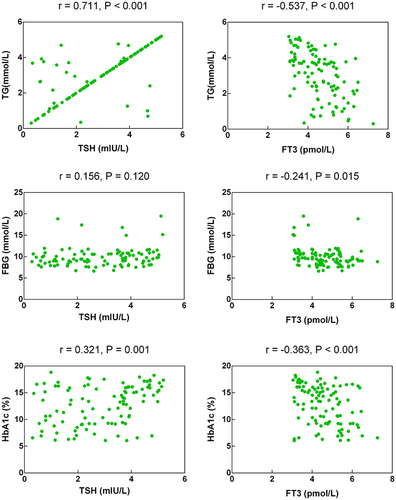
Figure 4 Correlation of TSH or FT3 with FBG, HbA1c or TG in diabetic retinopathy patients.
Abbreviations: TG, triglycerides; FBG, fasting blood glucose; HbA1c, glycated hemoglobin; TSH, thyroid stimulating hormone; FT3, free triiodothyronine.