
Figures & data
Table 1 Comparisons of Clinical Parameters Among the NC, T2DM and DPN Groups [n/M(P25, P75)]
Table 2 Comparison of Clinical Examinations, Biochemical Indicators and miRNA Among the Subgroups of DPN )/M(P25, P75)]
Table 3 Correlation Analysis of Peripheral Blood miR-155, miR-146a and Clinical Indexes in the DPN, T2DM and NC Groups
Table 4 Correlation Analysis Between Peripheral Blood miR-155, miR-146a and Clinical Indexes in DPN Subgroups
Table 5 Logistic Regression Analysis of Risk Factors of Clinical Outcome
Table 6 Predictive Value of ROC Curve of miR-155, miR-146a, Course of the Disease and All the Indexes in the Peripheral Blood
Figure 1 The biomarker potential of circulating miR-155 and miR-146a for distinguishing between DPN and T2DM was assessed through ROC curve analysis. Individually, circulating miR-155 showed a sensitivity of 91.8%, specificity of 37.3%, and AUC of 0.641(95% CI 0.532–0.750, P<0.05), while miR-146a had a sensitivity of 57.1%, specificity of 84.3%, and AUC of 0.722(95% CI 0.621–0.824, P<0.001).
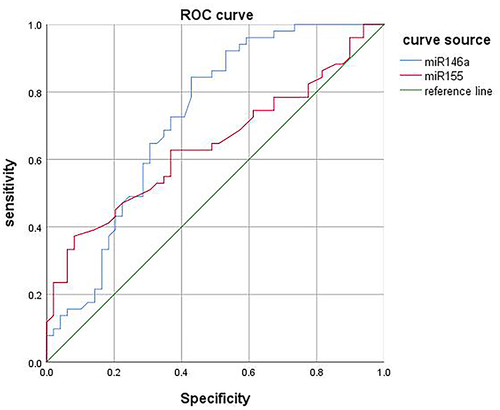
Figure 2 The Diagnostic Value of Combining Multiple Indicators for DPN;The AUC for the combined diagnostic use of miR-155 and miR-146a specific to DPN diagnosis reached 0.775 (95% CI 0.685–0.866, P < 0.001), with a sensitivity of 83.7% and a specificity of 60.8%. The AUC of disease duration specific to DPN diagnosis reached 0.681(95% CI 0.578–0.785, P= 0.002), with a sensitivity of 79.6% and a specificity of 49%.The AUC for the combined use of miR-155 with disease duration, miR-146a with disease duration, and all three factors combined were 0.720(95% CI 0.621–0.819, P<0.001), 0.788(95% CI 0.695–0.881, P<0.001), and 0.818(95% CI 0.733–0.903, P<0.001), respectively.
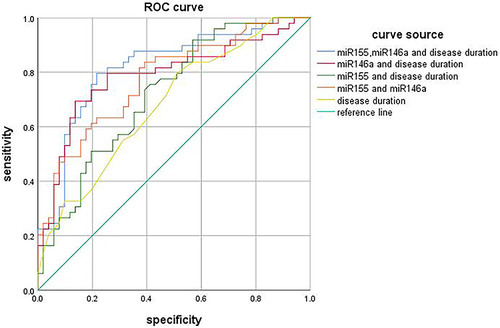
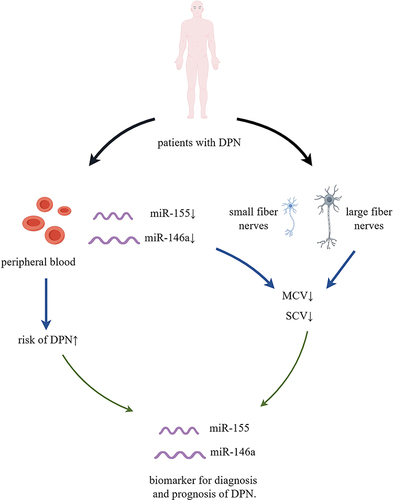
Figure 3 miR-155 and miR-146a effectively served as useful biomarkers for the diagnosis and prognosis of DPN.↑: increase; ↓: decrease.
Data Sharing Statement
The datasets used and/or analyzed during the current study are available from the corresponding author on reasonable request.