Figures & data
Table 1 Diagnostic Triad of Wernicke Encephalopathy
Figure 1 Fundus changes in Wernicke encephalopathy. At initial presentation (A), there is bilateral optic disc edema with peripapillary and scattered retinal hemorrhages. At one week (B) and two weeks (C) following thiamine supplementation, there is significant interval improvement. At three weeks (D) following treatment, there is complete resolution of the optic disc edema and retinal hemorrhages except one residual hemorrhage along the inferotemporal arcade of the left eye. Both optic discs became pale with final best-corrected visual acuity of 20/600 in each eye. Reprinted from J Formos Med Assoc, 112(3), Yeh WY, Lian LM, Chang A, Cheng CK. Thiamine-deficient optic neuropathy associated with Wernicke’s encephalopathy in patients with chronic diarrhea, 165–170, Copyright (2013), with permission from Elsevier.Citation36
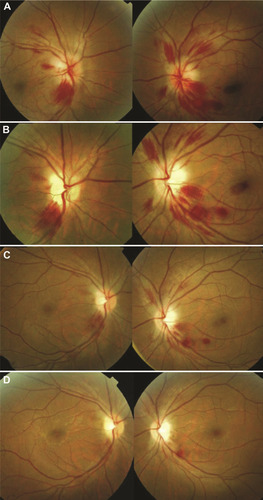
Figure 2 The metabolic pathways in which thiamine plays a critical role.
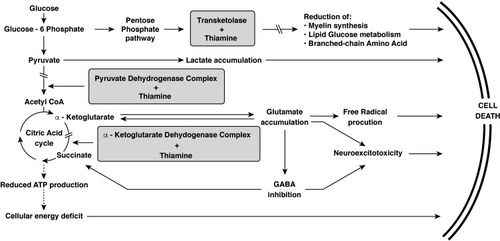
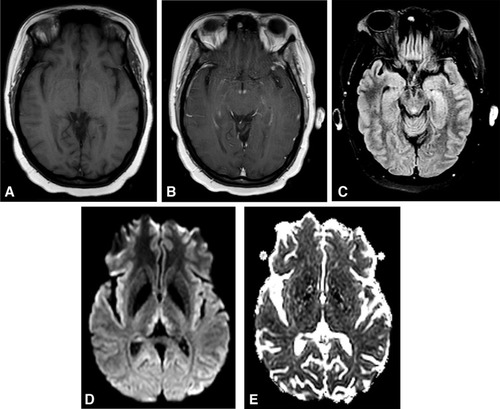
Figure 3 Brain MRI findings in Wernicke encephalopathy. Axial views. (A) Precontrast T1 scan is unremarkable. (B) Postcontrast T1 scan demonstrates enhancement of the mammillary bodies. (C) T2 FLAIR image reveals hyperintensity of the periaqueductal gray. (D) Diffusion-weighted imaging shows hyperintense signal in the medial thalami. (E) ADC map shows mild diffusion restriction, consistent with cytotoxic edema.